Education Infographics

Educational Technology Tools

Educational Materials

Education Information

Make an Infographic

How to Make an Infographic

The vector stencils library "Education pictograms" contains 128 color icons.
Use this flat icon set to design your educational infograms.
Educational infographics helps to communicate knowledge and education-related stories and messages as easy-to-understand one-page visuals.
The pictogram example "Design elements - Education pictograms" was created using the ConceptDraw PRO diagramming and vector drawing software extended with the Education Infographics solition from the area "Business Infographics" in ConceptDraw Solution Park.
Educational color icons
Infographic Tools

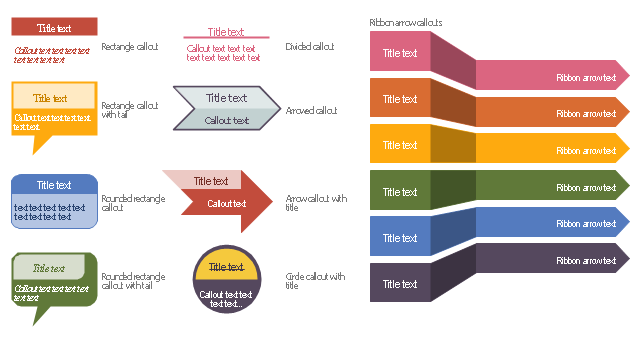
The vector stencils library "Education titled callouts" contains 14 titled callout blocks.
Use it to design your educational infograms.
"In publishing, a call-out or callout is a short string of text connected by a line, arrow, or similar graphic to a feature of an illustration or technical drawing, and giving information about that feature. The term is also used to describe a short piece of text set in larger type than the rest of the page and intended to attract attention.
A similar device in word processing is a special text box with or without a small "tail" that can be pointed to different locations on a document." [Callout. Wikipedia]
The shapes example "Design elements - Education titled callouts" was created using the ConceptDraw PRO diagramming and vector drawing software extended with the Education Infographics solition from the area "Business Infographics" in ConceptDraw Solution Park.
Titled callout blocks
The vector stencils library "Education charts" contains 12 graphs and charts: area chart, column chart, divided bar diagram, histogram, horizontal bar graph, line graph, pie chart, ring chart, scatter plot.
Use it to create your educational infograms.
"A chart can take a large variety of forms, however there are common features that provide the chart with its ability to extract meaning from data.
Typically the data in a chart is represented graphically, since humans are generally able to infer meaning from pictures quicker than from text. Text is generally used only to annotate the data.
One of the more important uses of text in a graph is the title. A graph's title usually appears above the main graphic and provides a succinct description of what the data in the graph refers to.
Dimensions in the data are often displayed on axes. If a horizontal and a vertical axis are used, they are usually referred to as the x-axis and y-axis respectively. Each axis will have a scale, denoted by periodic graduations and usually accompanied by numerical or categorical indications. Each axis will typically also have a label displayed outside or beside it, briefly describing the dimension represented. If the scale is numerical, the label will often be suffixed with the unit of that scale in parentheses. ...
The data of a chart can appear in all manner of formats, and may include individual textual labels describing the datum associated with the indicated position in the chart. The data may appear as dots or shapes, connected or unconnected, and in any combination of colors and patterns. Inferences or points of interest can be overlaid directly on the graph to further aid information extraction.
When the data appearing in a chart contains multiple variables, the chart may include a legend (also known as a key). A legend contains a list of the variables appearing in the chart and an example of their appearance. This information allows the data from each variable to be identified in the chart." [Chart. Wikipedia]
The shapes example "Design elements - Education charts" was created using the ConceptDraw PRO diagramming and vector drawing software extended with the Education Infographics solition from the area "Business Infographics" in ConceptDraw Solution Park.
Graphs and charts

Biology Illustration

 Education Package
Education Package is a comprehensive set of multifarious graphical solutions from ConceptDraw Solution Park, collected together in help to ConceptDraw PRO users working in a field of science, education and training, which is aimed at improving the quality of education and helping to design with ease variety of interesting and colorful educational materials, diagrams, charts and maps. Use it to present the information and knowledge in an interesting, clear, structured and simple form to achieve a success in education and pedagogy, to maintain the interest of students and pupils throughout the whole learning process, at the lectures, lessons and even during independent work with additional materials, to contribute to better perception of scientific information by listeners during the conferences and reports.
- How to Create Education Infographics | Make an Infographic | How ...
- Educational Materials | Make an Infographic | Education ...
- Education Infographics | Educational Materials | Information Graphic ...
- Educational Technology Tools | Education Infographics | Education ...
- How to Create a Typography Infographic Using ConceptDraw PRO ...
- How to Create Education Infographics | Education Infographics ...
- How to Create Education Infographics | Make an Infographic ...
- Educational Technology Tools | Education Infographics ...
- Education Infographics | Educational Technology Tools | Crow's foot ...
- How to Create Education Infographics | Education infogram 4 ...
- Educational Materials | Make an Infographic | Education Information ...
- Educational Technology Tools | Education Infographics | Biology ...
- How to Create Education Infographics | How to Create Management ...
- How to Draw a Сonstellation Сhart | How to Create Education ...
- Professions - Vector stencils library | Educational Technology Tools ...
- Education | Design elements - Education titled callouts | Educational ...
- Information Graphic | Educational Technology Tools | Biology ...
- Information Graphic | Education Information | Biology Illustration ...
- Education | Education Information | Business - Design Elements ...