Typography Infographic Examples

HelpDesk
How to Create a Typography Infographic Using ConceptDraw PRO

Typography Infographic Software

Infographic Generator

Typography Art

Typography Font

How to Create an Infographic

Infographic Software

Subway infographic design elements - software tools

Superb Examples of Infographic Maps

HelpDesk
How to Create Digital Media Infographics Using ConceptDraw PRO

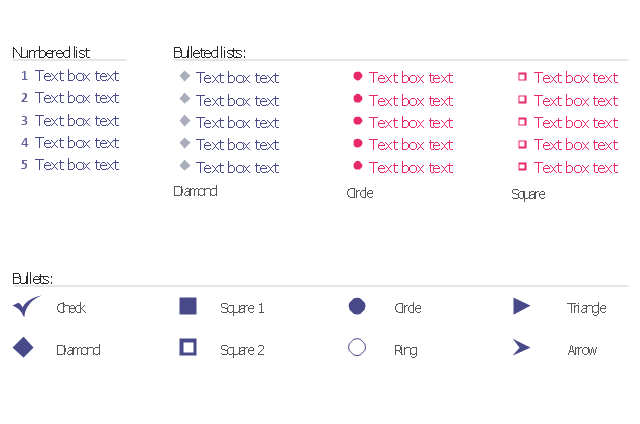
The vector stencils library "Bulleted and numbered lists" contains 12 elements of bulleted and numbered lists, and bullets for creating typography infographics.
"In typography, a bullet ( • ) is a typographical symbol or glyph used to introduce items in a list. ... The bullet symbol may take any of a variety of shapes, such as circular, square, diamond, arrow, etc., and typical word processor software offer a wide selection of shapes and colours. Several regular symbols are conventionally used in ASCII-only text or another environments where bullet characters are not available, such as * (asterisk), - (hyphen), . (period), and even o (lowercase O). Of course, when writing by hand, bullets may be drawn in any style. Historically, the index symbol was popular for similar uses." [Bullet (typography). Wikipedia]
The example "Design elements - Bulleted and numbered lists" was created using the ConceptDraw PRO diagramming and vector drawing software extended with the Typography Infographics solition from the area "What is infographics" in ConceptDraw Solution Park.
Typography infographics elements - Bulleted and numbered lists
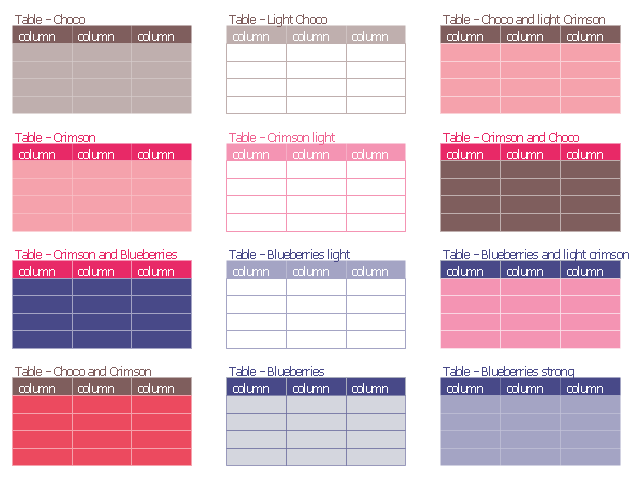
The vector stencils library "Tables" contains 12 table blocks. Use it to add typography elements into your infographics.
"A table is a means of arranging data in rows and columns. The use of tables is pervasive throughout all communication, research and data analysis. Tables appear in print media, handwritten notes, computer software, architectural ornamentation, traffic signs and many other places. The precise conventions and terminology for describing tables varies depending on the context. Further, tables differ significantly in variety, structure, flexibility, notation, representation and use. In books and technical articles, tables are typically presented apart from the main text in numbered and captioned floating blocks." [Table (information). Wikipedia]
The example "Design elements - Tables" was created using the ConceptDraw PRO diagramming and vector drawing software extended with the Typography Infographics solition from the area "What is infographics" in ConceptDraw Solution Park.
Typography infographics elements - Tables
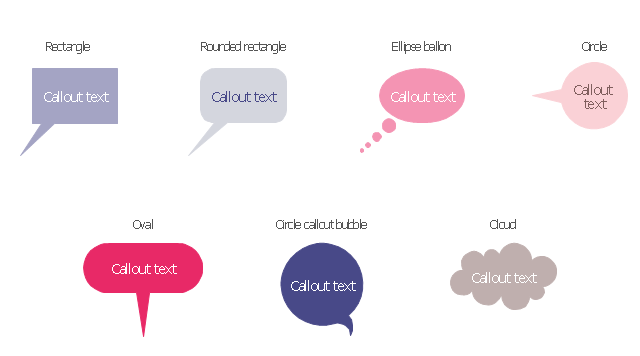
The vector stencils library "Callout" contains 7 callout shapes for drawing typography infographics.
"In publishing, a call-out or callout is a short string of text connected by a line, arrow, or similar graphic to a feature of an illustration or technical drawing, and giving information about that feature. The term is also used to describe a short piece of text set in larger type than the rest of the page and intended to attract attention.
A similar device in word processing is a special text box with or without a small "tail" that can be pointed to different locations on a document." [Callout. Wikipedia]
The example "Design elements - Callouts" was created using the ConceptDraw PRO diagramming and vector drawing software extended with the Typography Infographics solition from the area "What is infographics" in ConceptDraw Solution Park.
Typography infographics elements - Callouts
- Typography Infographic Examples | Brilliant Examples of ...
- Infographic Software | Typography Infographic Software ...
- Infographic Generator | How to Create a Typography Infographic ...
- How to Create a Typography Infographic Using ConceptDraw PRO ...
- Typography Graphic | How to Create a Typography Infographic ...
- Infographic Software | Typography Infographic Software | Subway ...
- Typography Infographic Software | How to Draw Pictorial Chart. How ...
- Typography Art | How to Create a Typography Infographic Using ...
- Typography Infographic Examples | Typography Art | Typography ...
- Design elements - ABC | How to Create a Typography Infographic ...
- Typography Infographic Examples | Typography Font | Typography ...
- Typography Font | How to Create an Infographic | How to Create a ...
- Typography Infographic Software | Infographic Software | Flowchart ...
- Flowchart Software Free Download | Typography Infographic ...
- Flowchart Software Free Download | Infographic Software ...
- Superb Examples of Infographic Maps | Typography Infographic ...
- Typography Infographic Software | Typography Infographic ...
- Infographic Maker | Infographic Software | Typography Infographic ...
- Bulleted List Infographic
- Design elements - Tables | How to Create a Typography Infographic ...