Technical Flow Chart
Flow chart is a diagrammatic representation of an algorithm and essential part of planning the system. Flow charts are widely used in technical analysis and programming for easy writing programs and explaining them to others. So, one of the most popular type of flow charts is Technical Flow Chart. Technical Flow Chart can be drawn by pencil on the paper, but it will be easier to use for designing a special software. ConceptDraw PRO diagramming and vector drawing software extended with Flowcharts Solution from the "Diagrams" Area of ConceptDraw Solution Park will be useful for this goal.Process Flow Chart Symbols
Process Flow Chart is a visual diagram which shows the processes and relationships between the major components in a system, and uses for this the special process flow chart symbols: special shapes to represent different types of actions and process steps, lines and arrows to represent relationships and sequence of steps. It often named process flow diagram, it use colored flowchart symbols. It is incredibly convenient to use the ConceptDraw PRO software extended with Flowcharts Solution from the "Diagrams" Area of ConceptDraw Solution Park for designing professional looking Process Flow Charts.Ordering Process Flowchart. Flowchart Examples
A flowchart is a widely used type of diagram that visually represents an algorithm, workflow or process, using the boxes of various kinds to depict the steps and connecting them with arrows to show the order of execution these steps. Еhe ConceptDraw PRO supplied with Accounting Flowcharts Solution from the Finance and Accounting Area of ConceptDraw Solution Park is a powerful diagramming and vector drawing software which ideally suits for designing Ordering Process Flowchart of any complexity.Business Process Mapping — How to Map a Work Process
ConceptDraw PRO is a world-class diagramming platform that lets you display, communicate, and present dynamically. It′s powerful enough to draw everything from basic flowcharts to complex engineering schematics. Video tutorials on ConceptDraw products. Try it today!Response to Customer Questions
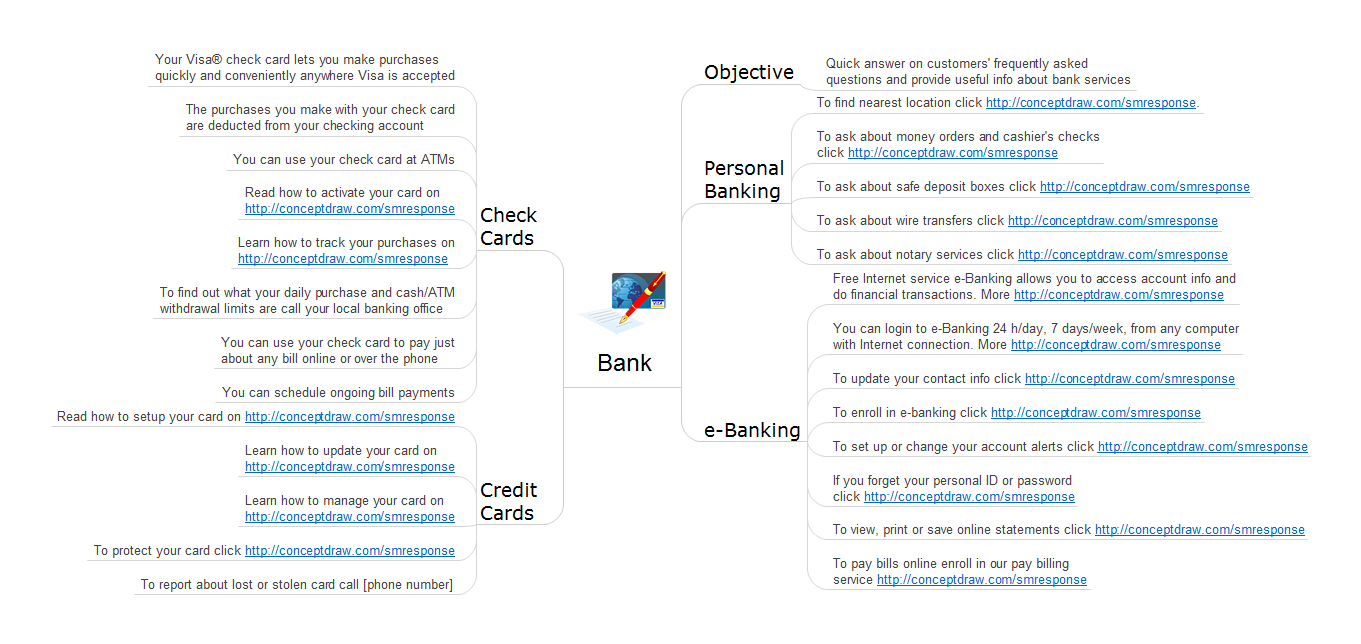
Response to Customer Questions - ConceptDraw PRO provides tools to develop a response flowchart that can be connected with Action Mind Maps. Visual navigation through the stages of a response process helps you locate specific actions to be taken via Action Mind Maps. Action Mind Maps can be used to describe primary messages and good additions, show examples of messages, and also define the main objective of messaging for a specific situation.Work Order Process Flowchart. Business Process Mapping Examples
The business process is a set of actions or tasks which are undertaken by an organization for production some goods or services, they are then offered for the customers and are ordered by them. Process Flowcharts and Order Process Flowcharts are sufficiently prevalent, well known and actively used in variety of fields of life, business and science. They are constructed using the common standardized symbols, thus are clear and understandable for all. They help effectively represent the processes, determine the order in which the process activities happen, document the order processes, and also effectively analyze the processes with a goal to increase their efficiency. Create your own Process Flowcharts, Order Process Flowcharts, Cross-Functional Flow Charts representing the order processing steps using powerful drawing tools of ConceptDraw PRO software and variety of predesigned vector objects from the libraries of Business Process Mapping Solution from Business Processes area of ConceptDraw Solution Park.Process Flowchart
The main reason of using Process Flowchart or PFD is to show relations between major parts of the system. Process Flowcharts are used in process engineering and chemical industry where there is a requirement of depicting relationships between major components only and not include minor parts. Process Flowcharts for single unit or multiple units differ in their structure and implementation. ConceptDraw PRO is Professional business process mapping software for making Process flowcharts, Process flow diagram, Workflow diagram, flowcharts and technical illustrations for business documents and also comprehensive visio for mac application. Easier define and document basic work and data flows, financial, production and quality management processes to increase efficiency of your business with ConcepDraw PRO. Business process mapping software with Flowchart Maker ConceptDraw PRO includes extensive drawing tools, rich examples and templates, process flowchart symbols and shape libraries, smart connectors that allow you create the flowcharts of complex processes, process flow diagrams, procedures and information exchange. Process Flowchart Solution is project management workflow tools which is part ConceptDraw Project marketing project management software. Drawing charts, diagrams, and network layouts has long been the monopoly of Microsoft Visio, making Mac users to struggle when needing such visio alternative like visio for mac, it requires only to view features, make a minor edit to, or print a diagram or chart. Thankfully to MS Visio alternative like ConceptDraw PRO software, this is cross-platform charting and business process management tool, now visio alternative for making sort of visio diagram is not a problem anymore however many people still name it business process visio tools.
Example Process Flow
A flowchart is a picture of the separate steps of a process in sequential order. ConceptDraw PRO is a Process Flowcharts software. This software includes basic package of process flow examples. The software contains object libraries with vector stencils that allows you use RapidDraw technology. By clicking on direction arrows you can add a new object to the flowchart.Sales Process Steps
Sales process engineering is a complex and labour-intensive process which requires a lot of time, efforts, and powerful software. We recommend to use the ConceptDraw PRO software enhanced with Sales Flowcharts solution from the Marketing area of ConceptDraw Solution Park. It gives the possibility to easy illustrate all sales process steps and their results.BPM Software
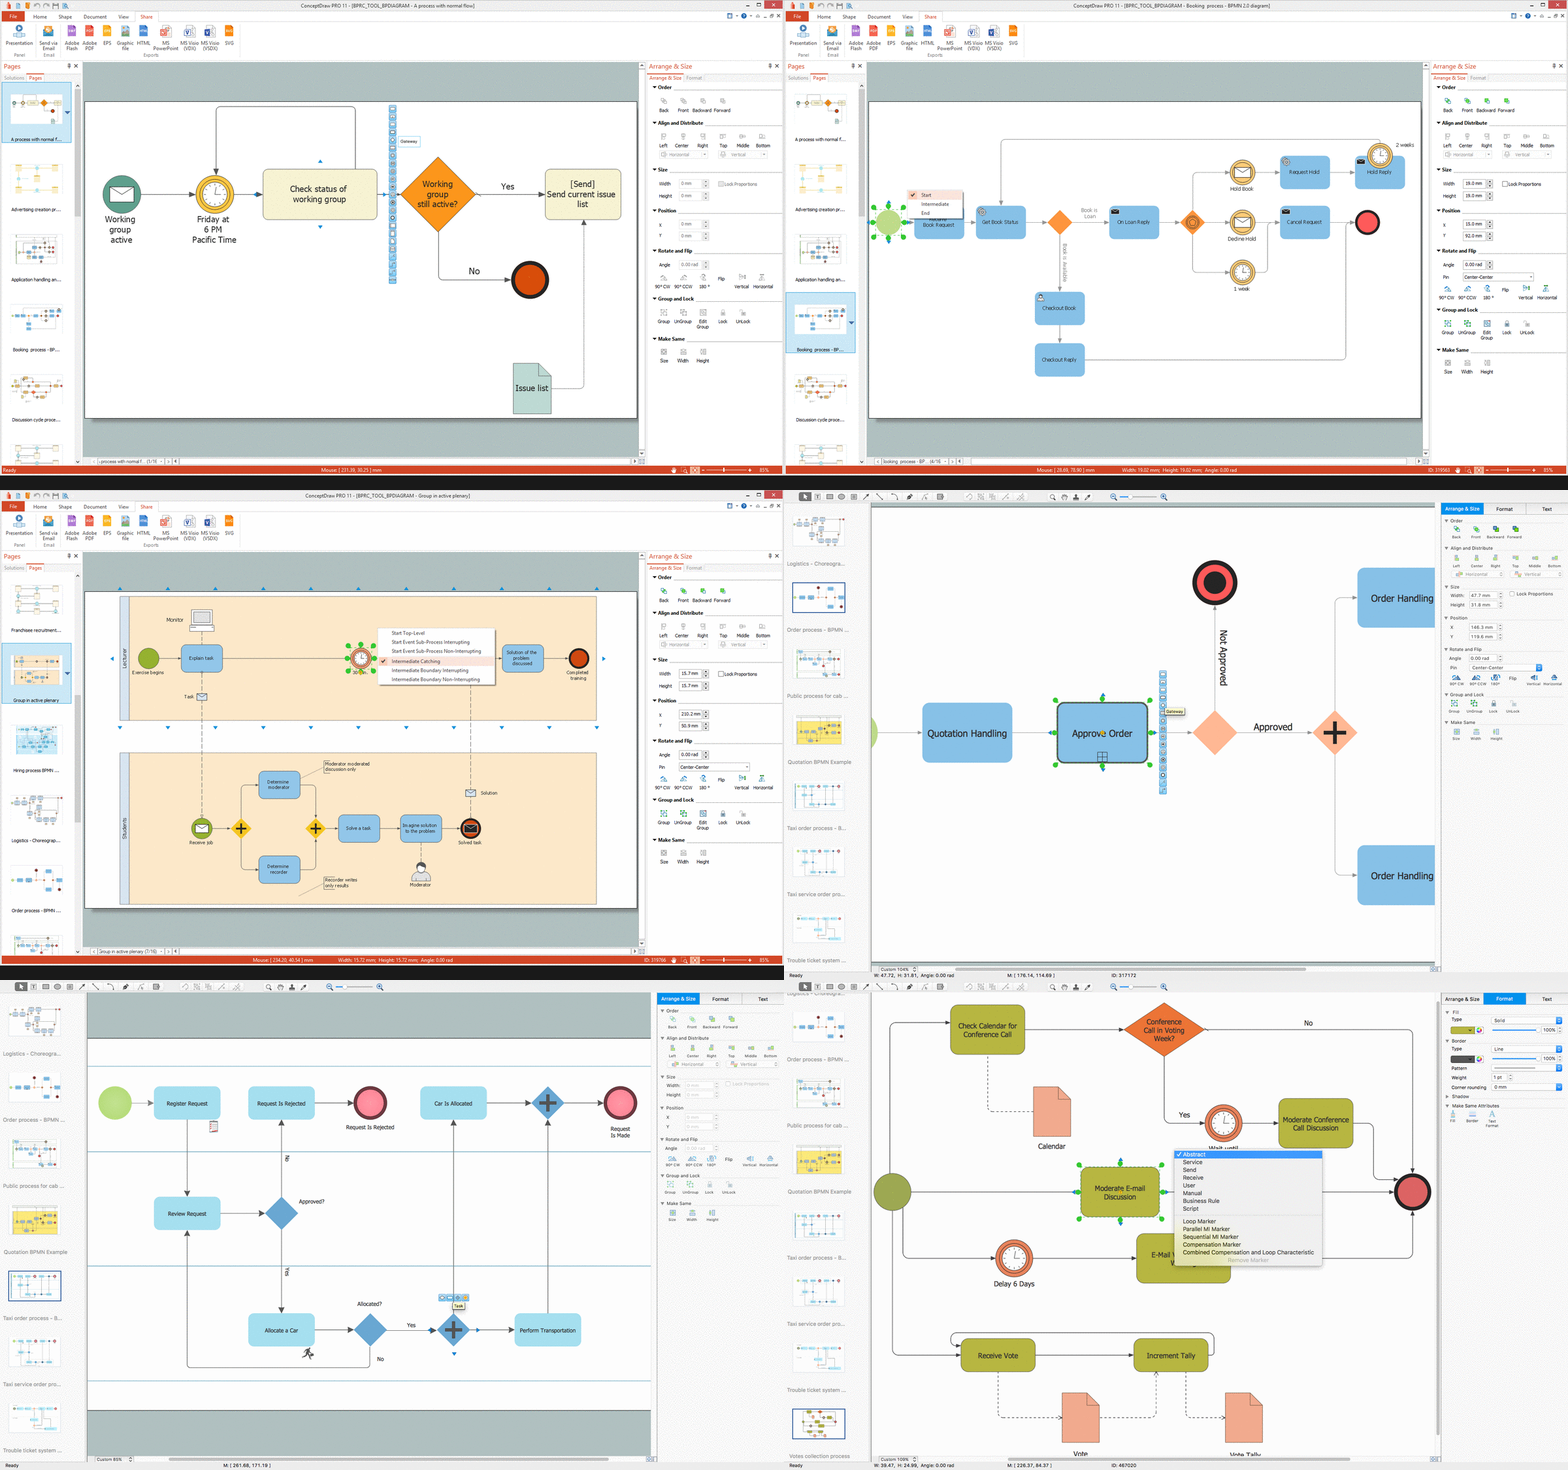
ConceptDraw PRO extended with Business Process Diagram Solution from the Business Processes Area is a powerful BPM Software which provides a set of useful drawing tools. Business Process Diagram Solution provides 16 libraries with wide variety of predesigned vector objects from BPMN 1.2 and BPMN 2.0, this is business process improvement tools.Best Program to Make Diagrams
Make diagrams, charts, workflows, flowcharts, org charts, project charts easily with ConceptDraw software.
Collaboration in a Project Team
Create with our data flow diagram software perfect data flow diagrams. Download data flow diagram software for FREE. Use hundreds of data flow diagram examples.Business Process Modeling Notation
ConceptDraw PRO is a software for simplу depicting the business processes based on BPMN 2.0. Business Process Diagrams Cross-Functional-Flowcharts, Workflows, Process Charts, IDEF0 and IDEF2, Timeline, Calendars, Gantt Charts, Business Process Modeling, Audit and Opportunity Flowcharts and Mind Maps (presentations, meeting agendas).Business Process Workflow Diagram
Business Process Workflow Diagram is a professional visual tool that is widely applied for business development, business analysis, business process optimization and documenting business processes. Business Process Workflow Diagram lets depict in details the steps of business processes and flow of tasks between them, the execution of business processes, transfer of data and documents. The workflows on the Business Process Workflow Diagram are represented using the set of common symbols which let easy illustrate business processes and process flows, depict the start, all major steps and end of the process, what data are used by the process, how the data flow through the business areas within scope of our project, how the tasks are executed and by who, and how workers interact with each other.
How to Draw EPC Diagram Quickly
An event-driven process chain diagram is a flowchart used in business process analysis. It evolved from Architecture of Integrated Information Systems (ARIS) and utilised in the business process improvement and analysis. It is also used to facilitate enterprise resource planning. An EPC diagram is a complex flowchart that shows different business processes through various workflows. The workflows are seen as functions and events that are connected by different teams or people, as well as tasks that allow business processes to be executed. ConceptDraw PRO is a software for making EPC diagrams that allows managers visually present business process models for making decisions for business.
- Basic Flowchart Symbols and Meaning | Design elements ...
- Basic Flowchart Symbols and Meaning | Types of Flowcharts | UML ...
- Flowchart design. Flowchart symbols, shapes, stencils and icons ...
- Basic Flowchart Symbols and Meaning | Design elements ...
- Design elements - Flowchart | Design elements - Process flowchart ...
- Process Flowchart | Basic Flowchart Symbols and Meaning | Types ...
- Flowchart design. Flowchart symbols, shapes, stencils and icons ...
- Swim Lane Flowchart Symbols | Cross-Functional Flowchart (Swim ...
- Types of Flowcharts | Flowchart Definition | Flow chart Example ...
- Basic Flowchart Symbols and Meaning | Flowchart | Cross ...
- Basic Flowchart Symbols and Meaning | Process Flowchart | Types ...
- Basic Flowchart Symbols and Meaning | Samples of Flowchart | How ...
- Flowchart Programming Project. Flowchart Examples | Easy ...
- Basic Flowchart Symbols and Meaning | Swim Lane Flowchart ...
- Basic Flowchart Symbols and Meaning | How to Draw a Flowchart ...
- Flowchart Problems And Solutions Examples
- Flowchart Summing Junction
- Flowchart Definition | Matrix Organization Structure | How to Draw a ...
- Process Flowchart | Basic Flowchart Symbols and Meaning | Types ...
- Program Logic And Write Algorithm Draw Flow Chart For That ...


