HelpDesk
How to Create a Timeline Diagram

How to Make a Timeline

Project Timeline

Timeline Examples

HelpDesk
How to Shift Dates in ConceptDraw PROJECT

Gantt Chart Software

HelpDesk
What Information to be Displayed in the ConceptDraw PROJECT Gantt Chart View

HelpDesk
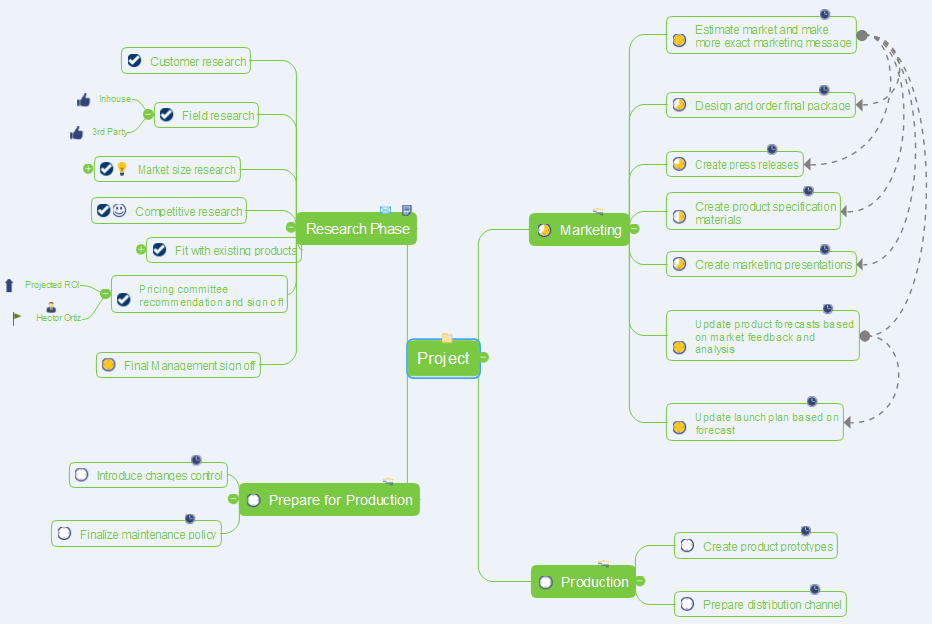
How to Make a Mind Map from a Project Gantt Chart

HelpDesk
How to Create a Gantt Chart for Your Project

How to Create Gantt Chart

Timeline Diagrams

HelpDesk
How to Make a Project Tasks Mind Map from Brainstorm
"The RFP presents preliminary requirements for the commodity or service, and may dictate to varying degrees the exact structure and format of the supplier's response. Effective RFPs typically reflect the strategy and short/ long-term business objectives, providing detailed insight upon which suppliers will be able to offer a matching perspective. ...
RFP:
(1) informs suppliers that an organization is looking to procure and encourages them to make their best effort.
(2) requires the company to specify what it proposes to purchase. If the requirements analysis has been prepared properly, it can be incorporated quite easily into the Request document.
(3) alerts suppliers that the selection process is competitive.
(4) allows for wide distribution and response.
(5) ensures that suppliers respond factually to the identified requirements.
(6) is generally expected to follow a structured evaluation and selection procedure, so that an organization can demonstrate impartiality - a crucial factor in public sector procurements." [Request for proposal. Wikipedia]
The project plan timeline diagram example "Request for proposal (RFP)" was created using the ConceptDraw PRO diagramming and vector drawing software extended with the Timeline Diagrams solution from the Management area of ConceptDraw Solution Park.
Project timeline
.png--diagram-flowchart-example.png)
How to Report Task's Execution with Gantt Chart

Business diagrams & Org Charts with ConceptDraw DIAGRAM


- How to Make a Timeline | How to Create a Timeline Diagram in ...
- Project plan timeline - Request for proposal (RFP) | Timeline ...
- Timeline Diagrams | How to Create a Timeline Diagram in ...
- Timeline Examples | How to Create a Timeline Diagram in ...
- How to Make a Timeline | Timeline Examples | Timeline Diagrams ...
- How to Create a Timeline Diagram in ConceptDraw PRO | How to ...
- How to Create a Timeline Diagram in ConceptDraw PRO | Project ...
- Design elements - Timelines and milestones | Project Timeline ...
- How to Make a Timeline | Timeline Diagrams | Project Timeline ...
- Sample Timeline For Project
- Project Timeline | Timeline Diagrams | Timeline Examples | Project ...
- How to Create a Timeline Diagram in ConceptDraw PRO | Timeline ...
- How to Create Multple Projects Schedule on Windows | How to ...
- Project Timeline | How to Make a Timeline | Timeline Diagrams ...
- How to Create a Timeline Diagram in ConceptDraw PRO | Project ...
- How to Make a Timeline | Timeline Diagrams | How to Create a ...
- Project timeline diagram - New business project plan | Business ...
- How to Make a Timeline | Project Timeline | Timeline Examples ...
- Timeline diagram | How to Create a Timeline Diagram in ...
- Process Flowchart | How to Create a Timeline Diagram in ...