HelpDesk
How to Draw the Different Types of Pie Charts
Using the Pie Chart, you can visually estimate the relative contribution that different data categories contribute to a whole value. The pie chart displays the statistics in a visual format. The main use of pie charts to show comparisons. The larger piece of the pie, the more the value of this value compared to the rest. Various applications of pie charts can be found in business and education. For business, pie charts can be used to compare the success or failure of the goods or services. They may also be used to display the business market share.HelpDesk
How to Draw a Pie Chart Using ConceptDraw PRO
A pie chart represents data, in a clear and easy to read round (pie) form. A circular pie chart is divided into sections (slice). Each "slice" depicts the It reflects the proportion of each component in the whole "pie". This type of chart is most often used for the visualization of statistical data. That is why pie charts are widely used in marketing. As pie charts show proportional proportional parts of a whole, they are good for various visual comparisons. For example, it is difficult to imagine a more intuitive way to show segmentation and market share. ConceptDraw PRO allows you to draw a simple and clear Pie Chart using the Pie Charts solution.HelpDesk
How to Draw an Area Chart in ConceptDraw PRO
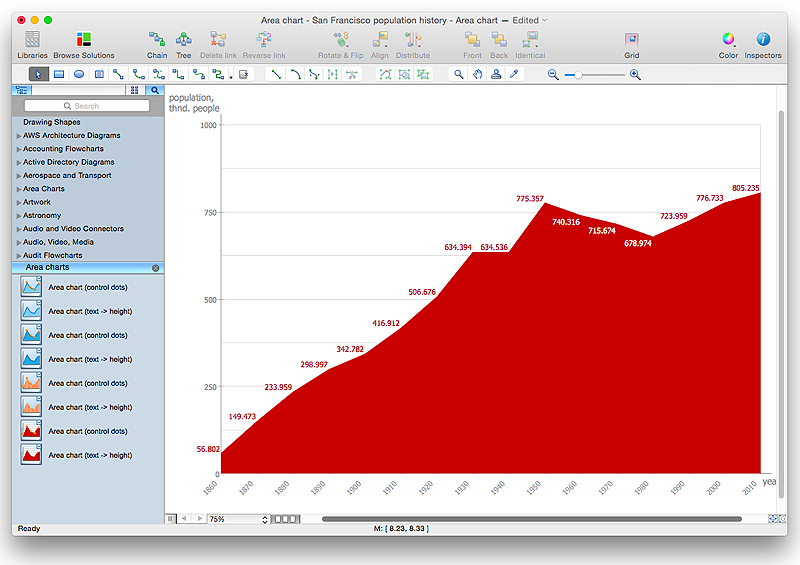
Area chart is similar to a line chart, but an area chart has an area, commonly filled with color below the line. The applying of Line charts and area charts are also very similar. They both show continuity across a data set. They are both can be used for displaying time series data and for depicting tendencies better than separate values, but they have some different characteristics. Using the proper one is good chance to show once again a professionalism of your graphic documents. An area chart depicts a colored area below the line. The sum on the vertical axis of an area chart represents the entire value, while the height of each separate piece shows its parts. Area charts are used to display multiple data series with proportion to a whole value , or for separate data series showing a set of countable values, or cumulative data.HelpDesk
How to Create a Timeline Diagram in ConceptDraw PRO
A Timeline is a chart which displays a project plan schedule in chronological order. A Timeline is used in project management to depict project milestones and visualize project phases, and show project progress. The graphic form of a timeline makes it easy to understand critical project milestones, such as the progress of a project schedule. Timelines are particularly useful for project scheduling or project management when accompanied with a Gantt chart. It captures the main of what the project will accomplish and how it will be done. making a project timeline is one of the most important skills a project manager needs have. Making comprehensive, accurate timelines allows you getting every project off in the best way. ConceptDraw PRO allows you to draw a timeline charts using special library.HelpDesk
How to Make a Basketball Court Diagram
Basketball Court diagrams is often used as a teaching and learning tool for coaches, players and parents to describe the basketball moves and shooting drills. The ability to create Basketball diagrams with ConceptDraw PRO is contained in the Basketball solution. It provides a set of special tools for creating different Basketball diagrams. Basketball court diagram is used to describe basketball moves and shooting drills during the discussion of the match, as well as to develop a winning defense and attack strategy as a clear visual plans for future games.HelpDesk
How to Use Mind Map Exchange Solution
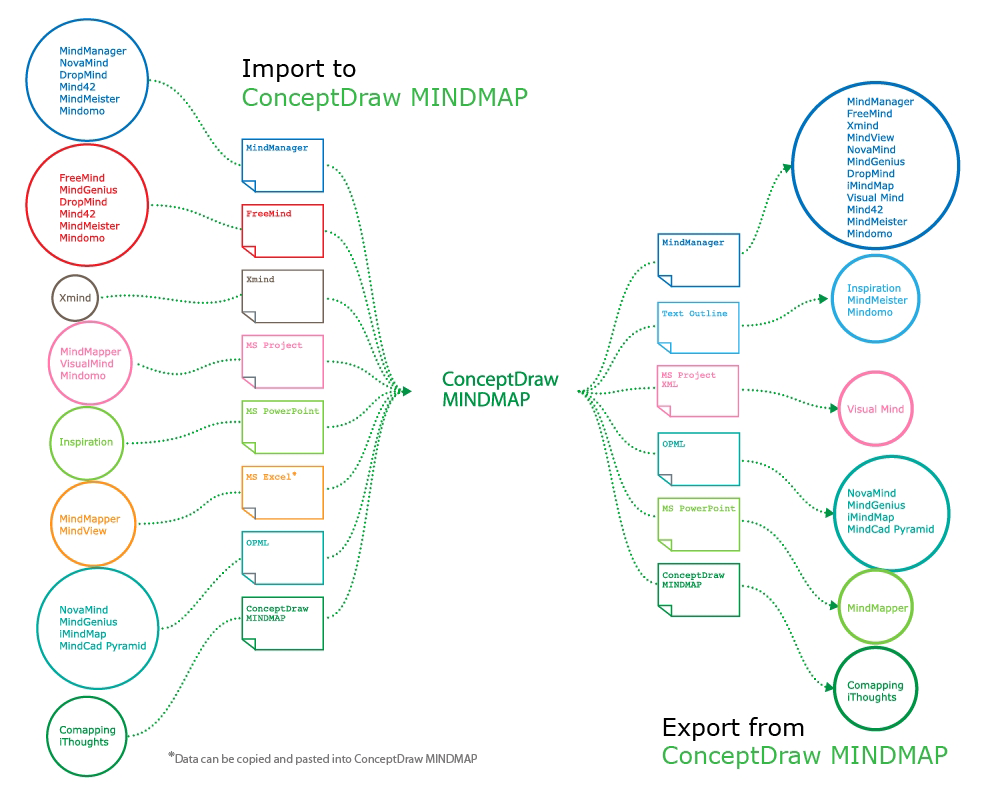
Tips on how to share mind maps among people uses different mind mapping software
- Process Flowchart | How to Draw the Different Types of Pie Charts ...
- How to Draw the Different Types of Pie Charts | Composition ...
- How to Draw the Different Types of Pie Charts | Ring chart ...
- How to Draw the Different Types of Pie Charts | How to Create a Pie ...
- How to Draw the Different Types of Pie Charts | Pie Chart Software ...
- How to Draw the Different Types of Pie Charts | Percentage Pie ...
- How to Draw the Different Types of Pie Charts | How to Draw a Pie ...
- Pie Chart Software | How to Draw the Different Types of Pie Charts ...
- How to Draw the Different Types of Pie Charts | Basic Flowchart ...
- Pie Charts | How to Draw the Different Types of Pie Charts | Pie ...
- Make A Flowchart Depicting Different Means Of Transport
- How to Draw the Different Types of Pie Charts | Basic Diagramming ...
- How to Draw the Different Types of Pie Charts | Pie Chart Software ...
- How to Draw the Different Types of Pie Charts | How to Add a ...
- Types of Flowcharts | Types of Flowchart - Overview | Basic ...
- How to Draw the Different Types of Pie Charts | How to Draw a Pie ...
- How to Create a Pie Chart | How to Draw the Different Types of Pie ...
- Pie Charts | How to Draw the Different Types of Pie Charts | Basic ...
- How to Draw the Different Types of Pie Charts | Pie charts - Vector ...


