HelpDesk
How to Create a Picture Graph in ConceptDraw PRO
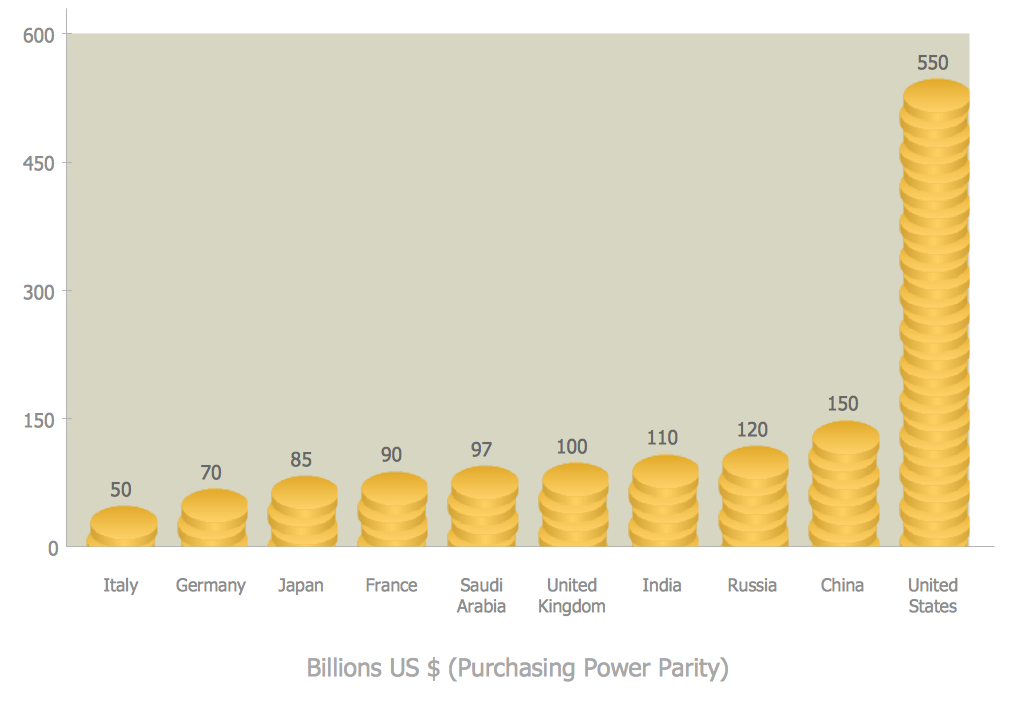
Picture Graphs are used commonly to represent non-complex data to a large audience. A Picture Graph is simple kind of marketing diagram used to show the relationship among various quantities. It include pictures or symbols to represent information visually. There are many cases when you have just some numbers to show and compare. This is not a reason to not use visual tools. You can produce a simple picture graph using memorable symbols to get the best visual presentation. Using specific symbols instead of regular colored bars makes picture graphs a much more descriptive tool. You can use tools from an existing library or find appropriate clipart in ConceptDraw’s collection. ConceptDraw PRO allows you to draw a simple and easy to understand Graph Charts using the special library.
 Picture Graphs
Typically, a Picture Graph has very broad usage. They many times used successfully in marketing, management, and manufacturing. The Picture Graphs Solution extends the capabilities of ConceptDraw PRO v10 with templates, samples, and a library of professionally developed vector stencils for designing Picture Graphs.
 ConceptDraw Solution Park
ConceptDraw Solution Park collects graphic extensions, examples and learning materials
 Computer Network Diagrams
Computer Network Diagrams solution extends ConceptDraw PRO software with samples, templates and libraries of vector stencils for drawing the computer network topology diagrams.
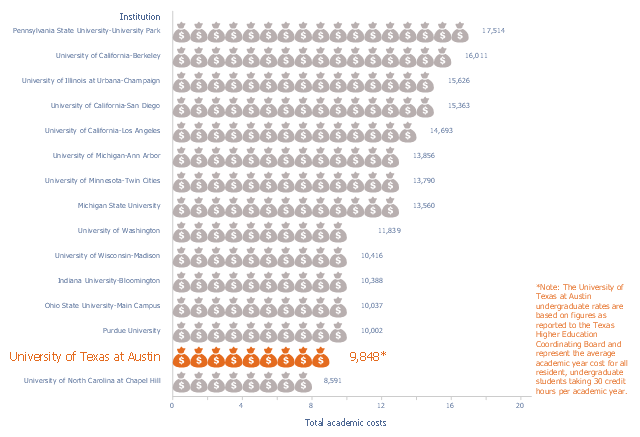
This picture bar graph sample shows the UT Austin Tuition Ranks 6th Compared to Other Texas Public Universities (Tuition and fees per semester, fall 2015). It was designed using data of the diagram "Compare UT Tuition" from the website of the University of Texas at Austin.
[tuition.utexas.edu/ compare]
The pictorial chart "Academic costs for residents, 2015-16" was created using the ConceptDraw PRO diagramming and vector drawing software extended with the Picture Graphs solution from the Graphs and Charts area of ConceptDraw Solution Park.
[tuition.utexas.edu/ compare]
The pictorial chart "Academic costs for residents, 2015-16" was created using the ConceptDraw PRO diagramming and vector drawing software extended with the Picture Graphs solution from the Graphs and Charts area of ConceptDraw Solution Park.
 Computers and Communications
Computers and communications solution extends ConceptDraw PRO software with illustration samples, templates and vector stencils libraries with clip art of computers, control devices, communications, technology, Apple machines.
 Plumbing and Piping Plans
Plumbing and Piping Plans solution extends ConceptDraw PRO v10.2.2 software with samples, templates and libraries of pipes, plumbing, and valves design elements for developing of water and plumbing systems, and for drawing Plumbing plan, Piping plan, PVC Pipe plan, PVC Pipe furniture plan, Plumbing layout plan, Plumbing floor plan, Half pipe plans, Pipe bender plans.
 Baseball
The Baseball Solution extends ConceptDraw PRO v9.5 (or later) software with samples, templates, and libraries of vector objects for drawing baseball diagrams, plays, and illustrations. It can be used to make professional looking documents, presentations,
 Line Graphs
How to draw a Line Graph with ease? The Line Graphs solution extends the capabilities of ConceptDraw PRO v10 with professionally designed templates, samples, and a library of vector stencils for drawing perfect Line Graphs.
 Bar Graphs
The Bar Graphs solution enhances ConceptDraw PRO v10 functionality with templates, numerous professional-looking samples, and a library of vector stencils for drawing different types of Bar Graphs, such as Simple Bar Graph, Double Bar Graph, Divided Bar Graph, Horizontal Bar Graph, Vertical Bar Graph, and Column Bar Chart.
 AWS Architecture Diagrams
The flexible AWS cloud solutions will help you to create reliable applications with a high level of scaling in the AWS cloud, to run your applications and accelerate their work on the level of security. Besides AWS resources are available worldwide and yo
 Computer and Networks Area
The solutions from Computer and Networks Area of ConceptDraw Solution Park collect samples, templates and vector stencils libraries for drawing computer and network diagrams, schemes and technical drawings.
 Value Stream Mapping
Value stream mapping solution extends ConceptDraw PRO software with templates, samples and vector stencils for drawing the Value Stream Maps (VSM) in lean manufacturing practice.
 Telecommunication Network Diagrams
Telecommunication Network Diagrams solution extends ConceptDraw PRO software with samples, templates, and great collection of vector stencils to help the specialists in a field of networks and telecommunications, as well as other users to create Computer systems networking and Telecommunication network diagrams for various fields, to organize the work of call centers, to design the GPRS networks and GPS navigational systems, mobile, satellite and hybrid communication networks, to construct the mobile TV networks and wireless broadband networks.
HelpDesk
How to Draw a Line Chart Quickly
A common line chart is a graphical representation of the functional relationship between two series of data. A line chart that is created by connecting a series of data points together with a straight line is the most basic type of a line chart. A line chart can be used for depicting data that changes continuously over time. It is extensively utilized in statistics, marketing and financial business. ConceptDraw Line Graph solution provides the possibility to make 2D line charts quickly and effortlessly.
 Cisco Network Diagrams
Cisco Network Diagrams solution extends ConceptDraw PRO software with samples, templates and libraries of vector stencils for drawing the Cisco computer network diagrams.
- Picture Graphs | Design elements - Picture graphs | How to Create a ...
- Picture Graphs | Universal Diagramming Area | Network Diagram ...
- Picture Graphs | SWOT Sample in Computers | How to Draw a ...
- How to Draw a Computer Network Diagrams | Picture Graphs ...
- How to Create a Picture Graph in ConceptDraw PRO | Bar Graphs ...
- Network diagrams with ConceptDraw PRO | Picture Graphs | Active ...
- Drawing Picture Graphs
- Picture Graphs | How to Create a Picture Graph in ConceptDraw ...
- Wireless Networks | Vehicular Networking | Picture Graphs ...
- Example A Picture Graph
- Picture Graphs | Picture graph template | Design elements - Picture ...
- Illustration Of Graphics Using Pictures Drawing Charts And Graph
- Home area networks (HAN). Computer and Network Examples ...
- Create Graphs and Charts | The Best Drawing Program for Mac ...
- Marketing | SWOT Sample in Computers | Picture Graphs | Swot ...
- Picture Graphs | Flowchart Example: Flow Chart of Marketing ...
- Picture Graphs | Active Directory diagrams with ConceptDraw PRO ...
- Pie Charts | Accounting Flowcharts | How to Draw Network Topology ...
- Pictures of Graphs | Astronomy Pictures | Food Pictures | Pict Page1 ...
- Fully Connected Network Topology Diagram | Picture Graphs | Line ...


