This site uses cookies. By continuing to browse the ConceptDraw site you are agreeing to our Use of Site Cookies.

Flow chart Example. Warehouse Flowchart
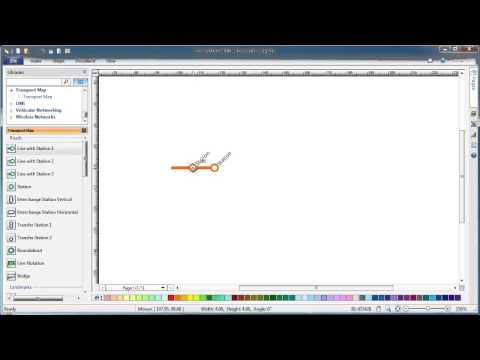
Warehouse Flowcharts are different diagrams describing wharehousing and inventory menagement processes. Typical purposes of warehouse flowcharts are evaluating warehouse performance and organizational performance, measuring efficiency of customer service. This type of workflow diagrams can be used for identifying any disconnection between business activities and business objectives.
Standard warehousing process flow diagram and standard workflow diagram used for process identification for further evaluating effectiveness and profitability of overall business process. Use the ConceptDraw PRO diagramming and vector drawing software extended with the Flowcharts solution from the Diagrams area of ConceptDraw Solution Park to design your own workflow diagrams, process flow diagram and flow charts. Need to use Process Flow Diagram for designing Warehouse packages flow.
ConceptDraw Arrows10 Technology

metro maps, subway map, mta subway map, metro train map, metro path map, subway train map Metro Map

metro maps, subway map, mta subway map, metro train map, metro path map, subway train map
Metro Map solution extends ConceptDraw PRO software with templates, samples and library of vector stencils for drawing the metro maps, route maps, bus and other transport schemes, or design tube-style infographics.

How to Draw Pictorial Chart. How to Use Infograms

How to draw pictorial chart quick, easy and effective? ConceptDraw PRO offers the unique Pictorial Infographics Solution that will help you!
Pictorial Infographics solution contains large number of libraries with variety of predesigned vector pictograms that allows you design infographics in minutes. There are available 10 libraries with 197 vector pictograms.

Design Pictorial Infographics. Design Infographics

In the course of recent decades data visualization went through significant development and has become an indispensable tool of journalism, business intelligence and science. The way visual information may be conveyed is not limited simply to static or dynamic representation, it can also be interactive. Infographics can be conditionally divided into several general levels. Primarily, this is level of visualization of information, its interpretation and association on any ground. Second level can be defined as a visualization of knowledge, depiction of thoughts and ideas in the form of images or diagrams. Finally, the level of data visualization, which processes data arrays in charts, enabling the information to be more clearly perceived. You can also identify the main approaches to the creation of infographics: exploratory and narrative. Exploratory method insists on minimalist design in favor of data precision without unnecessary details and is common for scientific researches and ana

aerospace symbols, transport symbols Aerospace and Transport

aerospace symbols, transport symbols
This solution extends ConceptDraw PRO software with templates, samples and library of vector clipart for drawing the Aerospace and Transport Illustrations. It contains clipart of aerospace objects and transportation vehicles, office buildings and anci

draw bar chart, draw bar graph, draw column chart Bar Graphs

draw bar chart, draw bar graph, draw column chart
The Bar Graphs solution enhances ConceptDraw PRO v10 functionality with templates, numerous professional-looking samples, and a library of vector stencils for drawing different types of Bar Graphs, such as Simple Bar Graph, Double Bar Graph, Divided Bar Graph, Horizontal Bar Graph, Vertical Bar Graph, and Column Bar Chart.

Tools to Create Your Own Infographics

Over the past few centuries, data visualization has evolved so much that we use it every day in all areas of our lives. Many believe that infographic is an effective tool of storytelling, as well as analytics, and that it is able to overcome most of the language and educational barriers. Understanding the mechanisms of human perception will help you to understand how abstract forms and colors used in data visualization can transmit information more efficient than long paragraphs of text.
HelpDesk

How to Make a Web Page from Your Metro Map

Using ConceptDraw PRO, you can create metro maps, route maps and various transport schemes. It is easy for anyone to build a map, one does not needed to be a cartographer to make good use of the ConceptDraw mapping solutions. Elaborate maps can be quickly assembled and then used on the web, printed, or made into signage. Graphical power and ease of use are built into the ConceptDraw mapping solutions. You can save your drawing as a Web pages. ConceptDraw PRO adds the HTML tags that are needed to display your diagrams in a Web browser, so all you have to do is design their appearance.
ConceptDraw Metro Map Solution

audit flowchart, fiscal flowchart, audit steps, chart audits, chart auditor, auditing process, audit process flowchart, audit planning process Audit Flowcharts

audit flowchart, fiscal flowchart, audit steps, chart audits, chart auditor, auditing process, audit process flowchart, audit planning process
Audit flowcharts solution extends ConceptDraw PRO software with templates, samples and library of vector stencils for drawing the audit and fiscal flow charts.
HelpDesk

How to Convert a Mind Map into MS Word Document

Mind maps are often used for structuring ideas, planning and organizing of various documents. ConceptDraw MINDMAP allows you transfer a mind map to MS Word format using its export facilities. You can convert a mind map to a MS Word outline using the set of standard templates, or even your custom template. Thus, your mind map will be transformed into the proper document format. Using a custom MS Word template allows you apply your individual style to each document, being exported from ConceptDraw MINDMAP. You can use a mind mapping to capture ideas and structure information. Then making a quick conversion to MS Word and you finally obtain a clean and stylish document.

UML Class Diagram Example for Transport System

This sample was created in ConceptDraw PRO diagramming and vector drawing software using the UML Class Diagram library of the Rapid UML Solution from the Software Development area of ConceptDraw Solution Park.
This sample shows the transport protocol mappings for SNMP (Simple Network Management Protocol), the classes of the transport system and relationships between them and is used in IP network.

accounting flowchart, accounting cycle, what is the accounting cycle, accounts payable process flow chart, accounts payable flowchart, steps of accounting cycle, accounting flowchart Accounting Flowcharts

accounting flowchart, accounting cycle, what is the accounting cycle, accounts payable process flow chart, accounts payable flowchart, steps of accounting cycle, accounting flowchart
Accounting Flowcharts solution extends ConceptDraw PRO software with templates, samples and library of vector stencils for drawing the accounting flow charts.

table seating chart template, seating charts template, template for seating chart, the seating arrangement, seating arrangement chart, seat plan, seating chart templates‏ Seating Plans

table seating chart template, seating charts template, template for seating chart, the seating arrangement, seating arrangement chart, seat plan, seating chart templates‏
The correct and convenient arrangement of tables, chairs and other furniture in auditoriums, theaters, cinemas, banquet halls, restaurants, and many other premises and buildings which accommodate large quantity of people, has great value and in many cases requires drawing detailed plans. The Seating Plans Solution is specially developed for their easy construction.

How to draw Metro Map style infographics? Moscow, New York, Los Angeles, London

The solution handles designs of any complexity, and the comprehensive library covers all key aspects of a transportation system. To further enhance your map design, there is the option to embed links, that can display station images or other relevant, important information. We have also included a set of samples in the solution, that show the possible real-world application — complex tube systems including the London Tube and New York City Subway show the level of detail possible when using the Metro Map Solution.

draw pie chart, draw donut chart Pie Charts

draw pie chart, draw donut chart
Pie Charts are extensively used in statistics and business for explaining data and work results, in mass media for comparison (i.e. to visualize the percentage for the parts of one total), and in many other fields. The Pie Charts solution for ConceptDraw PRO v10 offers powerful drawing tools, varied templates, samples, and a library of vector stencils for simple construction and design of Pie Charts, Donut Chart, and Pie Graph Worksheets.