This example of a Top Level Context Diagram for an information system management process was redesigned from the Wikipedia file: IDEF Top-Level Context Diagram.jpg. [en.wikipedia.org/ wiki/ File:IDEF_ Top-Level_ Context_ Diagram.jpg]
"Graphical notation.
IDEF0 is a model that consists of a hierarchical series of diagrams, text, and glossary cross referenced to each other. The two primary modeling components are:
(1) functions (represented on a diagram by boxes), and
(2) data and objects that interrelate those functions (represented by arrows).
... the position at which the arrow attaches to a box conveys the specific role of the interface. The controls enter the top of the box. The inputs, the data or objects acted upon by the operation, enter the box from the left. The outputs of the operation leave the right-hand side of the box. Mechanism arrows that provide supporting means for performing the function join (point up to) the bottom of the box.
The IDEF0 process.
The IDEF0 process starts with the identification of the prime function to be decomposed. This function is identified on a “Top Level Context Diagram,” that defines the scope of the particular IDEF0 analysis. ... From this diagram lower-level diagrams are generated." [IDEF0. Wikipedia]
The IDEF0 diagram example "Top-level context diagram" was created using the ConceptDraw PRO diagramming and vector drawing software extended with the IDEF0 Diagrams solution from the Software Development area of ConceptDraw Solution Park.
Data Flow Diagram (DFD)
A Data Flow Diagram (DFD) illustrates the flow of data through an information system, visualizes how the information is handled in terms of inputs and outputs, how the data enter to system and leave it. It is effective to use a Data Flow Diagram for creation the system's overview, to show the system's scope and boundaries. There are two different types of notations for DFDs: Yourdon-Coad and Gane-Sarson, which differ in visual representations for processes, data flow, data stores, external entities, etc. Thus, for example the processes are depicted as circles in Yourdon-Coad notation and as rounded squares in Gane-Sarson notation. Gane-Sarson notation is usually used for visualization information systems and Yourdon-Coad - for system analysis and design. The Data Flow Diagrams solution included to Software Development area of ConceptDraw Solution Park offers a lot of DFD templates, samples and examples, libraries of vector stencils for construction without efforts the DFDs according to both Gane-Sarson and Yourdon-Coad notations.Design Data Flow. DFD Library
Data flow diagram or DFD is a type of diagrams used for graphical representation the "flow" of data through an information system, for effective modeling its process aspects and for visualization the data processing. They are one of the best tools for clearly making an overview of the system that will be developed, for depiction in details what kinds of information will be inputted to the system and outputted from it, where they will be stored, and other details. ConceptDraw DIAGRAM software with Data Flow Diagrams solution from Software Development area of ConceptDraw Solution Park is powerful in a field of designing the DFDs. Three libraries containing 49 vector DFD shapes and symbols are offered by Data Flow Diagrams (DFD) solution. Use them to design data flow diagrams, information flow diagrams, data flowcharts, data process diagrams, structured analysis diagrams, to create the data-oriented models or process-oriented models, and so on. Pay also attention for the included collection of DFD samples, examples and built-in templates at ConceptDraw STORE.Selecting & Creating Flowcharts
ConceptDraw Flowcharts visualize a process or algorithm of program as step/operation blocks of various shapes connected with arrowed lines showed the process flow direction. They are used to visualize business or technical processes and software algorithms.Maps and Directions
ConceptDraw DIAGRAM diagramming and vector drawing software extended with Directional Maps Solution from the Maps Area of ConceptDraw Solution Park is a powerful maps and directions design software. Let's review the tools of this solution.Computer Network Architecture. Computer and Network Examples
The network architecture and design specialization will help you gain the technical leadership skills you need to design and implement high-quality networks that support business needs.
Social Media Response DFD Flowcharts - diagramming software ( Mac PC )
Diagramming software for Mac and PC - create flowcharts and presentations for Social Media Organizing.
Examples of Flowcharts, Org Charts and More
ConceptDraw DIAGRAM covers a broad spectrum of business graphics categories and offers at ConceptDraw STORE enormous online collection of pictorial examples and samples for different thematics and application areas. It is a plentiful source of inspiration and wonderful examples of professionally designed diagrams, flowcharts, UML diagrams, organizational charts, databases, ERDs, network diagrams, business charts, different thematic charts, schematics, infographics and plans developed specially for knowledge workers, engineers, managers, businessmen, marketing specialists, analytics, scientists, students, professors, journalists and also for a large number of other people that every day use various diagrams and drawings in their work and life activity. Each of these examples is a real art, all they are well thought-out and designed without efforts with help of powerful tools of ConceptDraw DIAGRAM software. ConceptDraw examples display all variety of tasks, possibilities and results that ConceptDraw Product Line lets achieve fast and easy. ConceptDraw is one of the best Visio alternatives for Mac. It open all Visio formats like.vsdx,.vss,.vdx files and allows you to export files to Visio formats.
eLearning - Easy English on Skype
Learning English On-line using Skype. Mind map as a presentation makes it powerful tool for eLearning. E-Learning tools are slideshows, presentations, videos, mind maps.
Use a Fishbone Diagram to Attack Complex Problems
Any project is a complex system which rarely goes without some problems, even the most minor. But the success of the project mostly depends from the ability effectively solve appearing problems. There are many methods for problem solving, one of the most effective is the use a Fishbone diagram to attack complex problems. Use ConceptDraw DIAGRAM diagramming software with Fishbone Diagrams Solution to attack any complex problems with fishbone diagrams graphic method. Construct Fishbone diagram to help users brainstorm and break down a complex problem.Human Resource Development
Human Resource Development (HRD) focuses on the help employees develop their personal and organizational skills, abilities, and knowledge, HRD also helps to adapt an organization to the changing of external environment. ConceptDraw DIAGRAM diagramming and vector drawing software supplied with HR Flowcharts Solution from the Management Area of ConceptDraw Solution Park can effectively help in labour-intensive process of human resource development.Infographic Maker
Infographic is a visual way of representing various information, data, knowledge in statistics, geography, journalism, education, and much more areas. ConceptDraw DIAGRAM supplied with Pictorial Infographics Solution from the “Infographics” Area, provides a set of powerful pictorial infographics tools. Thanks to them it is the best Infographic Maker.Basic Diagramming
Block diagrams are essentially a very simple format of diagrams. A variety of commonly used shapes and connecting lines, rules of construction and actions pertaining to them, make Block diagram a versatile and flexible tool for many forms of industry. Another advantage is the ease with which Block diagrams can be constructed, especially if you use professional diagramming software. ConceptDraw DIAGRAM software is an example of purpose built application designed with the form of process modeling in mind. It includes Block Diagrams solution from Diagrams area of ConceptDraw Solution Park for easy drawing professional-looking simple diagram - Block diagram, and a lot of other useful solutions for designing variety of other types of diagrams, schematics and flowcharts (Line graphs, Bar charts, Organizational charts, Histograms, Pie charts, Process flowcharts, Fault tree analysis diagrams, Scatter plots, Venn diagrams, Bubble diagrams, etc.). The RapidDraw functionality of ConceptDraw DIAGRAM lets create new objects and their connectors in just single-click.
HelpDesk
How to Create a Healthcare Management Workflow Diagram
The health and medical workflow diagrams are widespread in medicine to depict the sequence of actions of the medical workers to eliminate particular health problems of the patient. Also drawing is the best way to illustrate processes occurring in the human body. Healthcare Management Workflow Diagrams for ConceptDraw DIAGRAM provides the large set of colorful samples and libraries with predesigned vector pictograms and symbols of health, healthcare equipment, medical instruments, pharmaceutical tools, transport, medication, etc. The Healthcare Management Workflow Diagrams solution found in the Business Processes section of ConceptDraw Solution Park is the best choice for designing clear and comprehensive Medical Workflow Diagrams, Healthcare Management Flowcharts and Infographics.
Directional Maps
Directional Maps solution extends ConceptDraw DIAGRAM software with templates, samples and libraries of vector stencils for drawing the directional, location, site, transit, road and route maps, plans and schemes.
Marketing and Sales Organization chart. Organization chart Example
The use of Organization Charts is very popular at the fields of marketing and sales. They help to depict in a visual form a lot of information about organization: the company's structure, relationships of positions within an organization in terms of authorities and responsibilities, and company's strategies. All Organizational Charts are constructed from the similar building blocks (rectangles and lines), this makes them easily for interpretation and understanding by all interested people inside and outside of this company, such as shareholders, employees, investors, distributors, suppliers, customers, etc. Organization Charts can be hand-drawn on the paper, however the preferable is to use a special software. ConceptDraw DIAGRAM diagramming and vector graphics software extended with useful Organizational Charts solution is ideal for easy representing information and data, and professional drawing Marketing and Sales Organization Chart with any depth of detailing. Organizational structure may differ during the company's development, you can design and compare the charts on each stage.UML Tool & UML Diagram Examples
The Unified Modeling Language (abbr. UML) is a general-purpose modeling language widely used in the field of software development, software engineering, education, science, industry, business. In 1997 the UML was approved as a standard by the OMG (Object Management Group) and in 2005 was published as ISO standard by the International Organization for Standardization. UML is widely and succesfully applied for optimization the process of software systems development and business systems analysis. There are used 14 types of UML diagrams, 7 from them depict structural information, another 7 types represent different types of behavior and aspects of interactions. Design of any automated process is easy with ConceptDraw DIAGRAM and unique Rapid UML solution from the Software Development area, which provides numerous UML examples, templates and vector stencils libraries for drawing all types of UML 1.x and UML 2.x diagrams. Use of predesigned UML diagram examples and templates lets you quickly start drawing your own UML diagrams in ConceptDraw DIAGRAM software.UML Use Case Diagram. Design Elements
UML Use Case Diagrams are used to illustrate the structure of arbitrarily complex systems and illustrates the service consumer - service provider relationship between components.
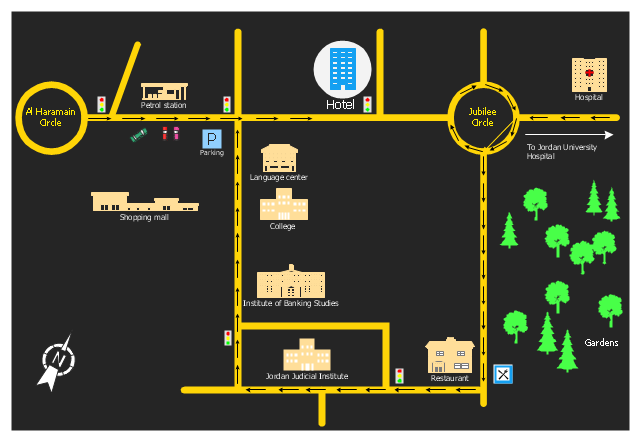
"A locator map, sometimes referred to simply as a locator, is typically a simple map used in cartography to show the location of a particular geographic area within its larger and presumably more familiar context. Depending on the needs of the cartographer, this type of map can be used on its own or as an inset or addition to a larger map. ...
Direct marketing.
The widespread distribution of sophisticated Geographic Information System (GIS) mapping techniques has allowed the development of large-scale customized locator maps that can be tailored to individual consumers in direct marketing campaigns. This sophistication allows a variety of customized locator maps to be produced in a relatively short period of time. Major types of direct marketing locator maps are:
Single Location: A single business location is shown with major street and road connections. While this type of map can be efficiently constructed using GIS with existing street databases and customized map templates, special software is not required because the map does not change for each direct mailing." [Locator map. Wikipedia]
This example was created using the ConceptDraw PRO diagramming and vector drawing software extended with the Directional Maps solution from the Maps area of ConceptDraw Solution Park.
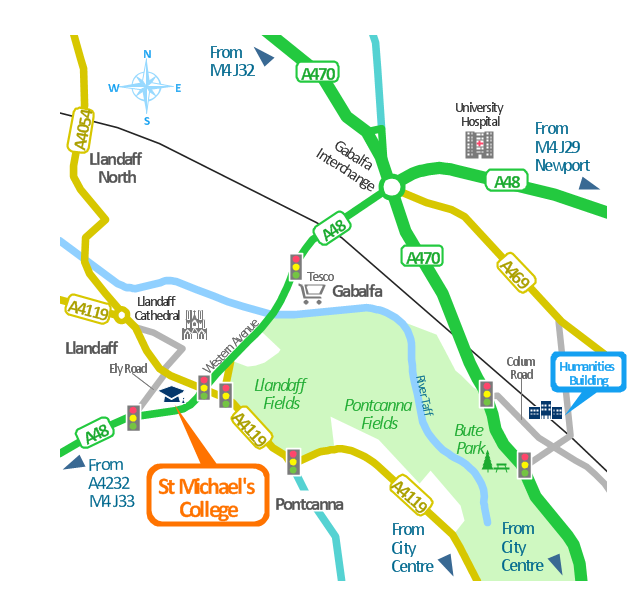
This spatial infographics was created on the bese of the conference centre location map from the website. [cf.ac.uk/ share/ research/ centres/ clarc/ newsandevents/ isns-conference-2013-booking-information.html]
"The terms location and place in geography are used to identify a point or an area on the Earth's surface or elsewhere. The term location generally implies a higher degree of certainty than place, which often indicates an entity with an ambiguous boundary, relying more on human/ social attributes of place identity and sense of place than on geometry.
Types of location/ place.
(1) A relative location is described as a displacement from another site...
(2) A locality is likely to have a well-defined name but a boundary which is less well defined and which varies by context." [Location (geography). Wikipedia]
The spatial infographics example "Conference centre location map" was created using the ConceptDraw PRO diagramming and vector drawing software extended with the Spatial Infographics solution from the area "What is Infographics" of ConceptDraw Solution Park.
- Context Diagram Of Hospital Management System
- Healthcare Management Workflow Diagrams | Data Flow Diagram ...
- Data Flow Diagram Model | Hospital Dfd Context - Conceptdraw.com
- Context Diagram About Hospital Carding System
- Top-level context diagram | Logistic Dashboard | Flowchart Symbols ...
- Data Flow Diagram Symbols. DFD Library | Dfd 1level Diagram For ...
- Data Flow Diagram For Hospital Appointment System
- Data Flow Diagram For Hospital In Software Engineering
- Network Layout Floor Plans | Timeline Diagrams | Business Process ...
- Data Flow Diagram For Hospital Management System Level 0
- | Hospital Zero Level Data Flow Diagram
- Entity Relationship Diagram Examples
- Give The Data Flow Diagram For Hospital Management System
- Data Flow Diagram | Healthcare Management Workflow Diagrams ...
- Hospital Management System Dfd Context Level
- Level 0 Diagram For A Hospital Management System
- Data Flow Diagram | Dfd For Hospital Management System Ppt
- Context Diagram For Pharmacy Management System
- Flowchart For Hospital Management For A Low Level Flow Chart
- Data Flow Diagrams (DFD) | Diagram Of Hospital Management In Dfd


