How to Create a Pie Chart

Pie Chart Examples and Templates

HelpDesk
How to Draw the Different Types of Pie Charts

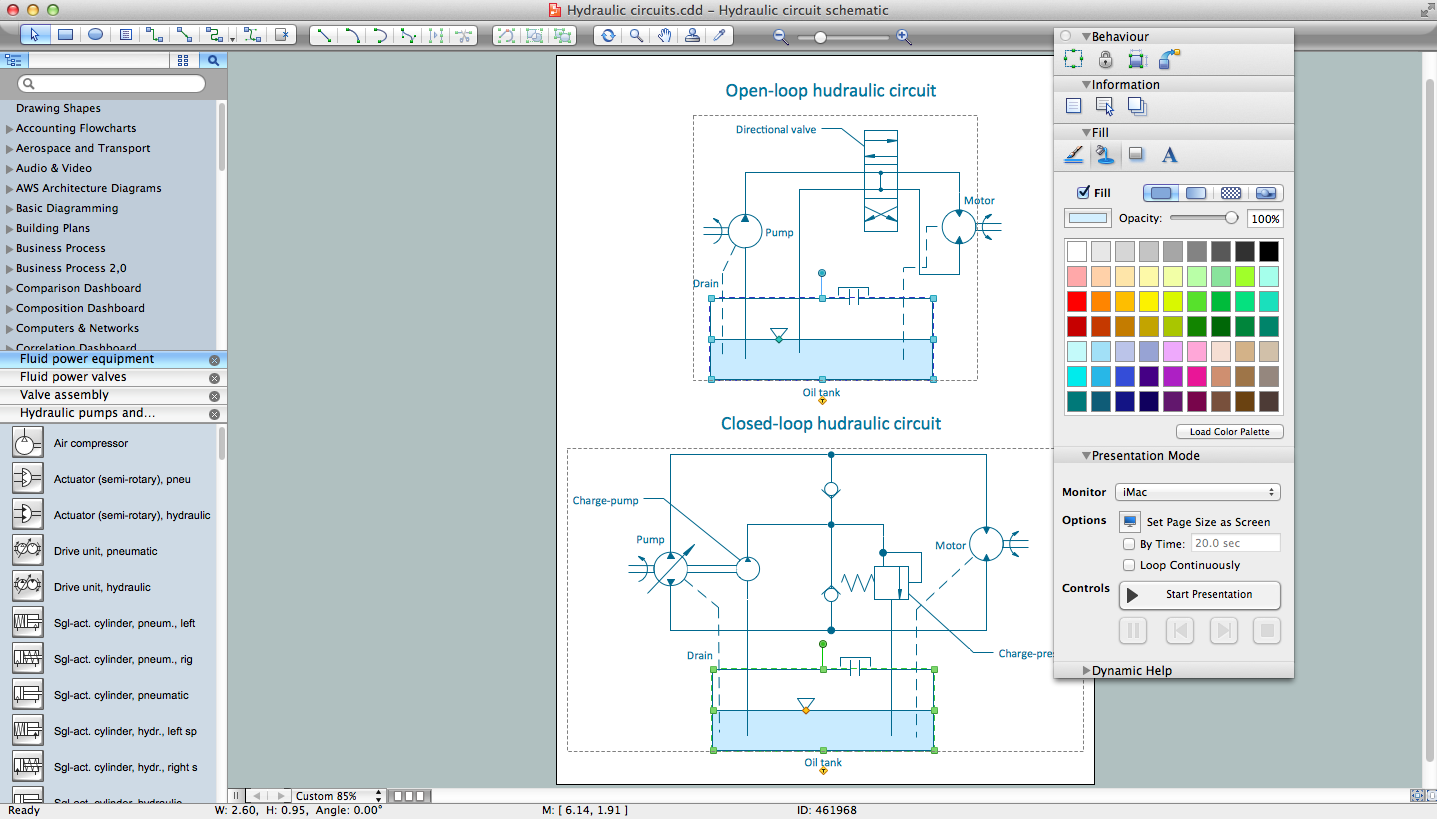
Technical Drawing Software
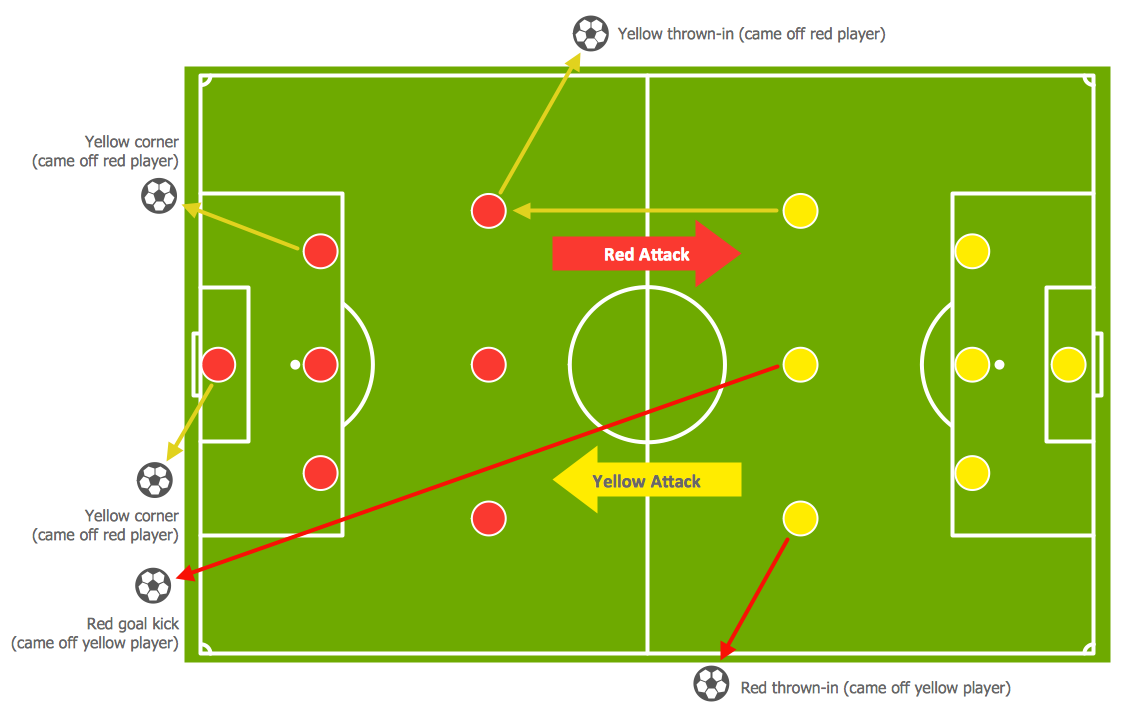
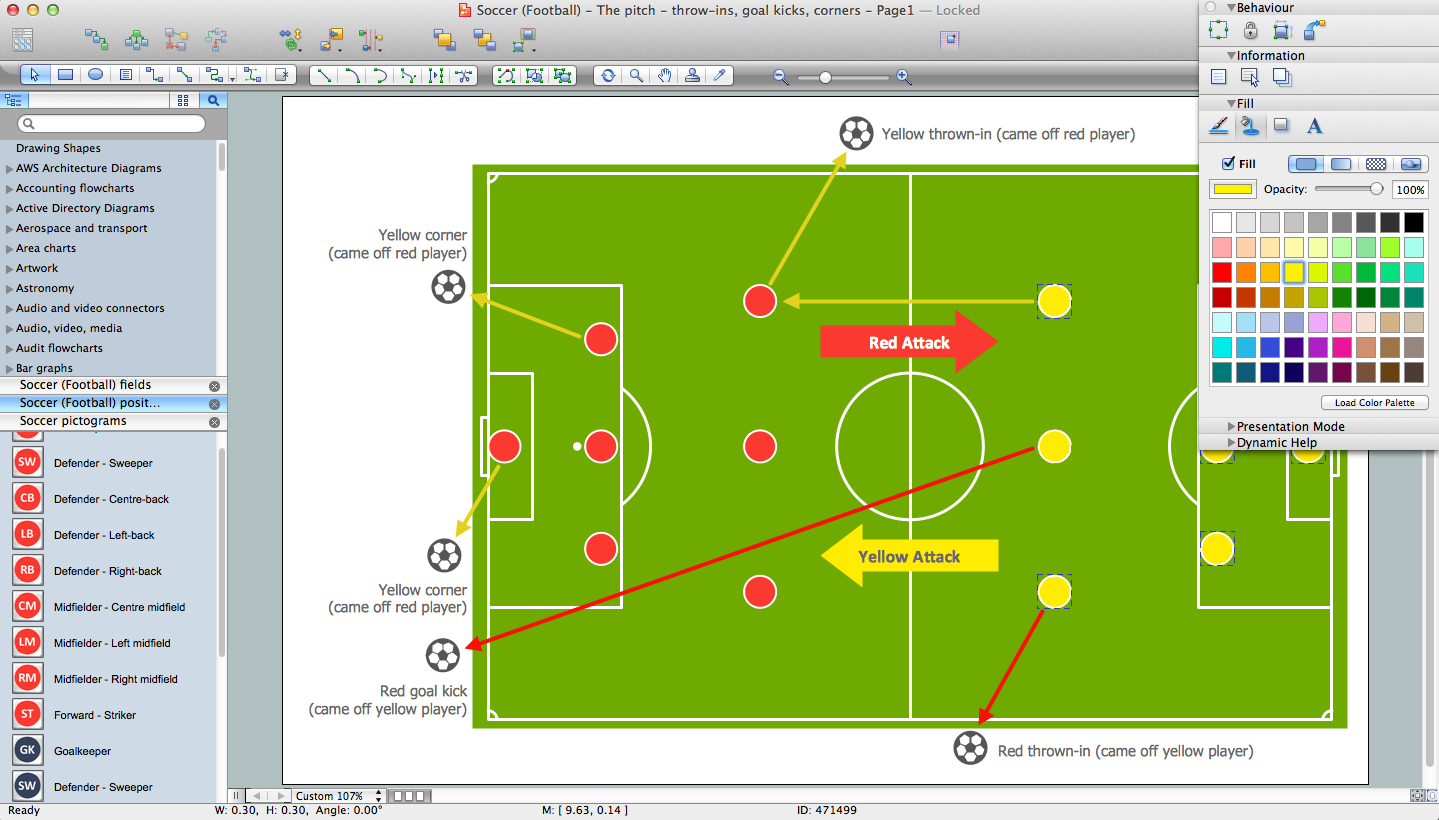
Soccer (Football) Tactics
How To Create Onion Diagram

 Pie Charts
Pie Charts are extensively used in statistics and business for explaining data and work results, in mass media for comparison (i.e. to visualize the percentage for the parts of one total), and in many other fields. The Pie Charts solution for ConceptDraw DIAGRAM offers powerful drawing tools, varied templates, samples, and a library of vector stencils for simple construction and design of Pie Charts, Donut Chart, and Pie Graph Worksheets.
 Computer Network Diagrams
Computer Network Diagrams solution extends ConceptDraw DIAGRAM software with samples, templates and libraries of vector icons and objects of computer network devices and network components to help you create professional-looking Computer Network Diagrams, to plan simple home networks and complex computer network configurations for large buildings, to represent their schemes in a comprehensible graphical view, to document computer networks configurations, to depict the interactions between network's components, the used protocols and topologies, to represent physical and logical network structures, to compare visually different topologies and to depict their combinations, to represent in details the network structure with help of schemes, to study and analyze the network configurations, to communicate effectively to engineers, stakeholders and end-users, to track network working and troubleshoot, if necessary.
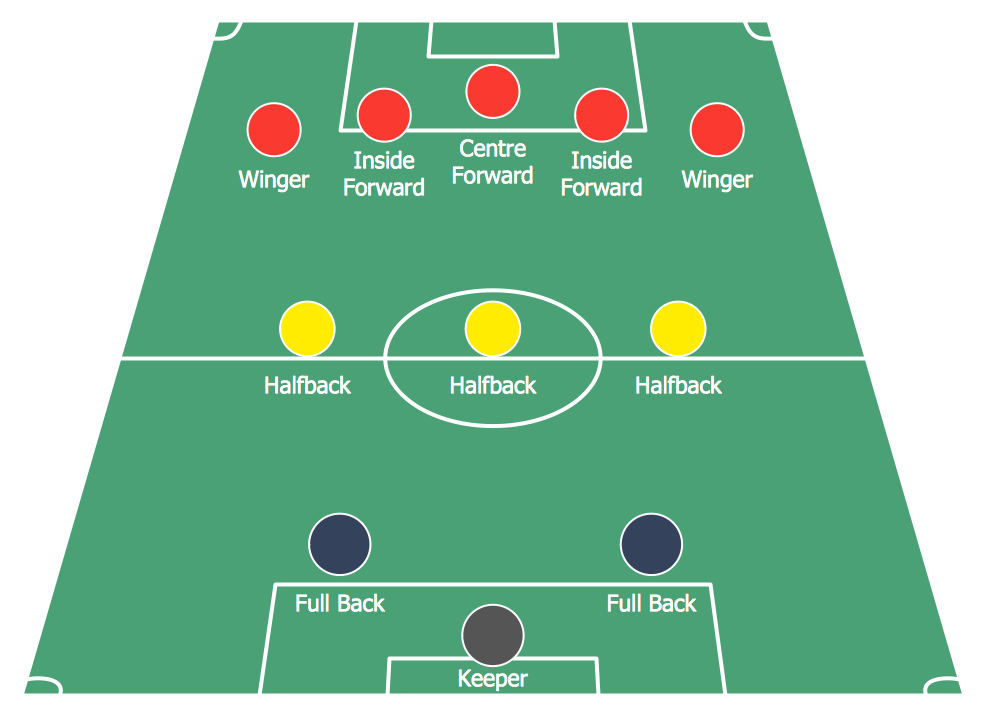
Soccer (Football) Formation
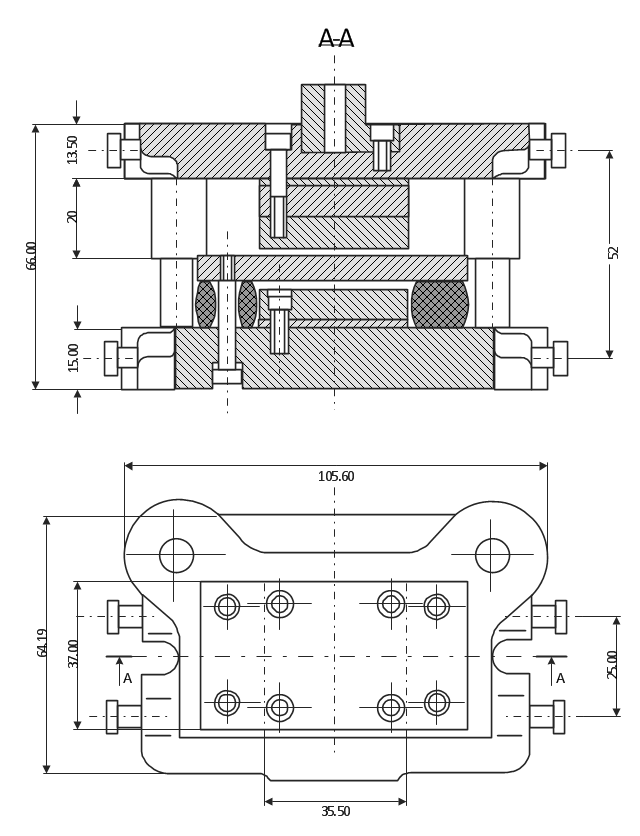
This technical drawing shows the machine parts assembly using joining by threaded fasteners.
"Assembling (joining of the pieces) is done by welding, binding with adhesives, riveting, threaded fasteners, or even yet more bending in the form of a crimped seam. Structural steel and sheet metal are the usual starting materials for fabrication, along with the welding wire, flux, and fasteners that will join the cut pieces. As with other manufacturing processes, both human labor and automation are commonly used. The product resulting from fabrication may be called a fabrication. Shops that specialize in this type of metal work are called fab shops. The end products of other common types of metalworking, such as machining, metal stamping, forging, and casting, may be similar in shape and function, but those processes are not classified as fabrication." [Metal fabrication. Wikipedia]
This mechanical engineering drawing example was designed using ConceptDraw PRO diagramming and vector drawing software extended with Mechanical Engineering solution from Engineering area of ConceptDraw Solution Park.
Soccer (Football) Diagram Software
Affinity Diagram

 ATM UML Diagrams
The ATM UML Diagrams solution lets you create ATM solutions and UML examples. Use ConceptDraw DIAGRAM as a UML diagram creator to visualize a banking system.
"An automated teller machine or automatic teller machine" (ATM) (American, Australian, Singaporean, Indian, and Hiberno-English), also known as an automated banking machine (ABM) (Canadian English), cash machine, cashpoint, cashline or hole in the wall (British, South African, and Sri Lankan English), is an electronic telecommunications device that enables the clients of a financial institution to perform financial transactions without the need for a cashier, human clerk or bank teller.
On most modern ATMs, the customer is identified by inserting a plastic ATM card with a magnetic stripe or a plastic smart card with a chip that contains a unique card number and some security information such as an expiration date or CVVC (CVV). Authentication is provided by the customer entering a personal identification number (PIN). The newest ATM at Royal Bank of Scotland allows customers to withdraw cash up to £100 without a card by inputting a six-digit code requested through their smartphones.
Using an ATM, customers can access their bank accounts in order to make cash withdrawals, get debit card cash advances, and check their account balances as well as purchase pre-paid mobile phone credit. If the currency being withdrawn from the ATM is different from that which the bank account is denominated in (e.g.: Withdrawing Japanese yen from a bank account containing US dollars), the money will be converted at an official wholesale exchange rate. Thus, ATMs often provide one of the best possible official exchange rates for foreign travellers, and are also widely used for this purpose." [Automated teller machine. Wikipedia]
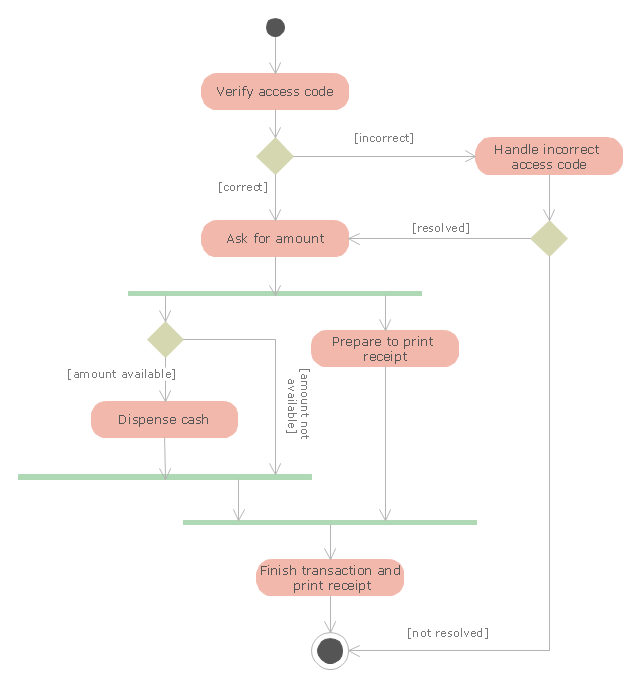
The UML activity diagram example "Cash withdrawal from ATM" was created using the ConceptDraw PRO diagramming and vector drawing software extended with the Rapid UML solution from the Software Development area of ConceptDraw Solution Park.
On most modern ATMs, the customer is identified by inserting a plastic ATM card with a magnetic stripe or a plastic smart card with a chip that contains a unique card number and some security information such as an expiration date or CVVC (CVV). Authentication is provided by the customer entering a personal identification number (PIN). The newest ATM at Royal Bank of Scotland allows customers to withdraw cash up to £100 without a card by inputting a six-digit code requested through their smartphones.
Using an ATM, customers can access their bank accounts in order to make cash withdrawals, get debit card cash advances, and check their account balances as well as purchase pre-paid mobile phone credit. If the currency being withdrawn from the ATM is different from that which the bank account is denominated in (e.g.: Withdrawing Japanese yen from a bank account containing US dollars), the money will be converted at an official wholesale exchange rate. Thus, ATMs often provide one of the best possible official exchange rates for foreign travellers, and are also widely used for this purpose." [Automated teller machine. Wikipedia]
The UML activity diagram example "Cash withdrawal from ATM" was created using the ConceptDraw PRO diagramming and vector drawing software extended with the Rapid UML solution from the Software Development area of ConceptDraw Solution Park.
UML activity diagram
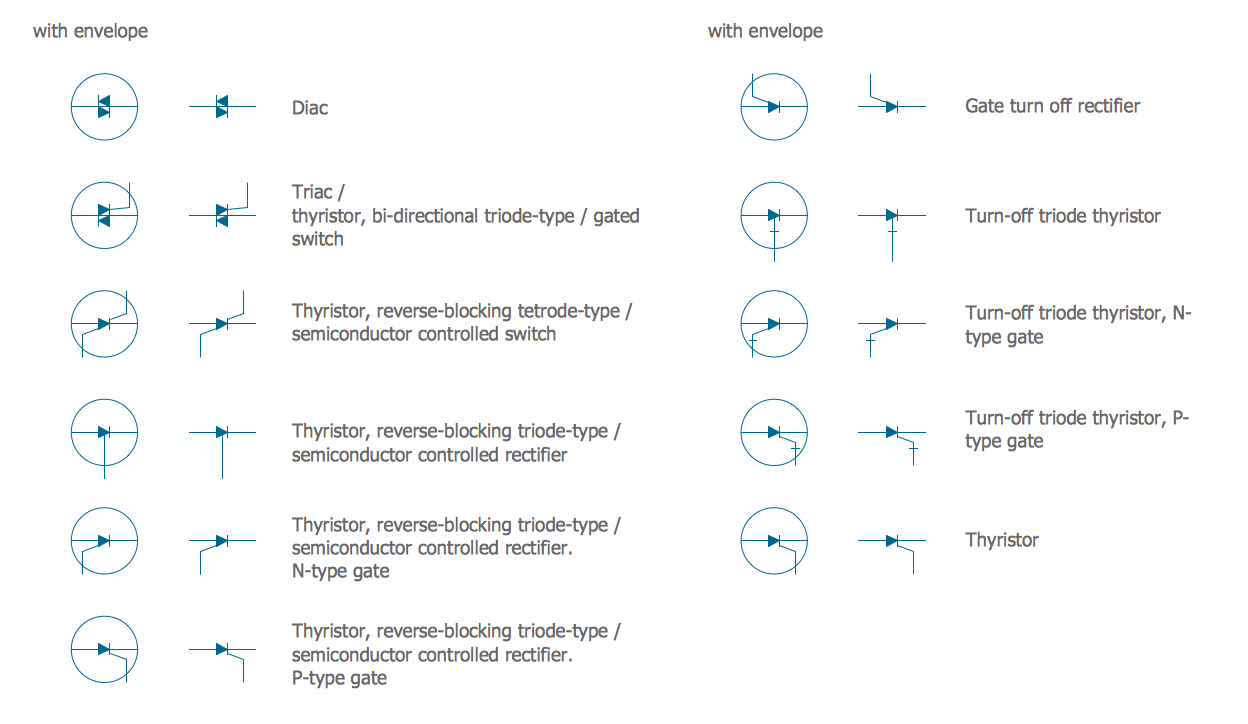
Electrical Symbols — Semiconductor
- Mechanical Drawing Symbols | Mechanical Engineering | Electrical ...
- Hole Drawing Symbols
- Mechanical Drawing Symbols | Design elements - Bearings ...
- Mechanical Drawing Symbols | Design elements - Bearings ...
- Mechanical Drawing Symbols | Bearings - Vector stencils library ...
- Mechanical Drawing Symbols | Bearings - Vector stencils library ...
- Sphere Symbol In Engg Drawing
- Mechanical Drawing Symbols | Bearings - Vector stencils library ...
- Firewall With Hole
- Mechanical Drawing Symbols | Bearings - Vector stencils library | To ...
- How to Create a Mechanical Diagram | Technical Drawing Software ...
- Sun Planet Diagram
- UML activity diagram
- Energy Pyramid Diagram | Electrical Drawing Software and ...
- How To Draw Building Plans | Interior Design Site Plan - Design ...
- Bearings - Vector stencils library | Ball Bearing Conventional Diagram
- Network Security Devices | Network Security | Internet symbols ...
- UML for Bank | ATM UML Diagrams | Bank UML Diagram | Uml Bank
- Technical Drawing Software | Mechanical Drawing Symbols ...