Chart Examples

Project Timeline

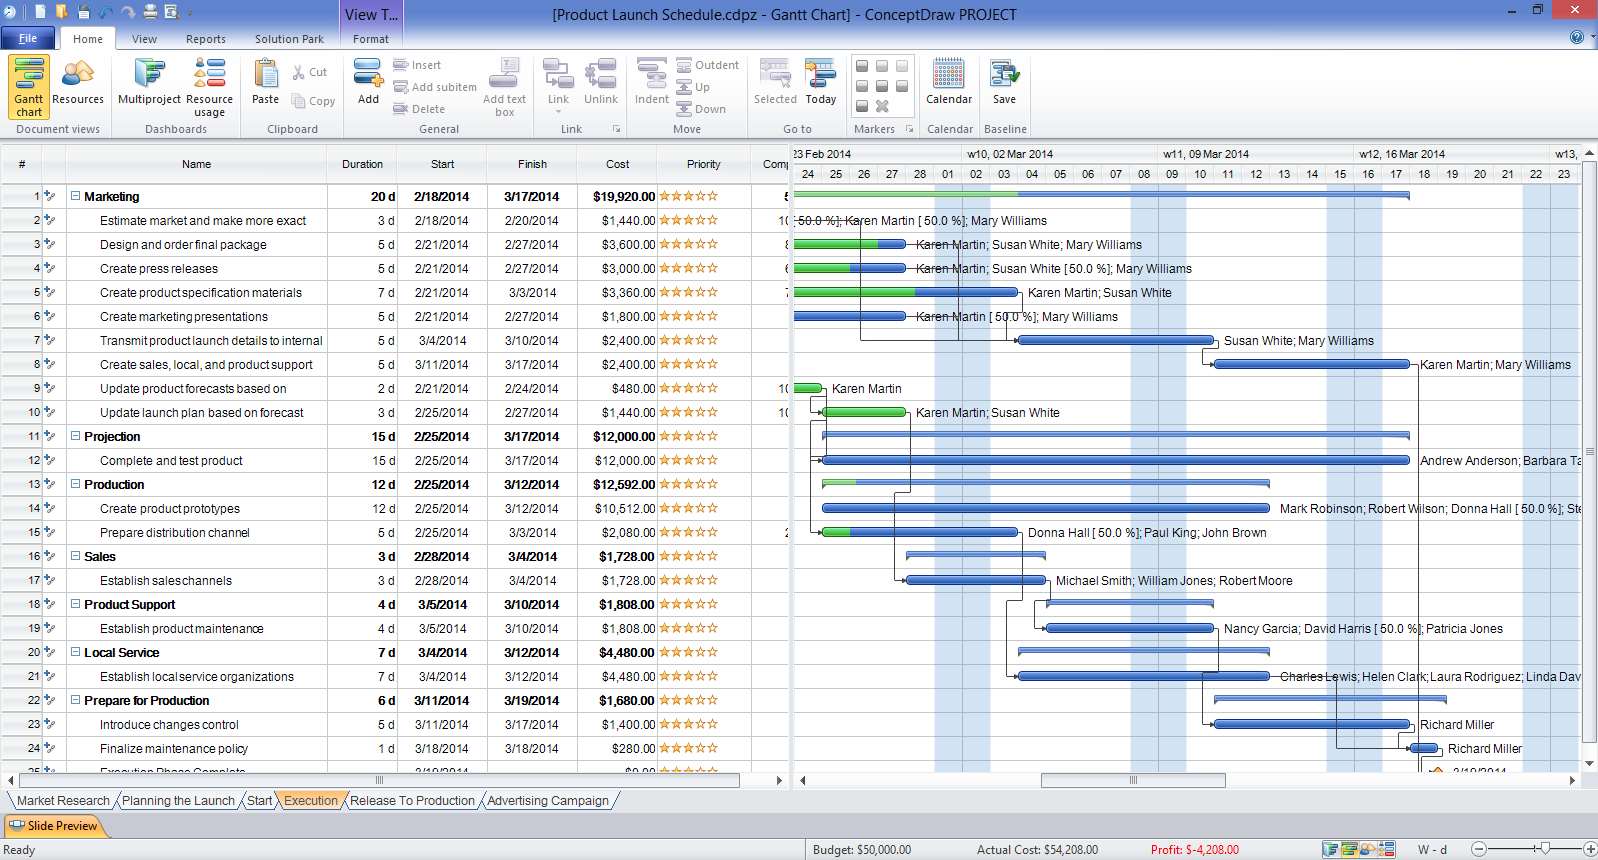
Gantt charts for planning and scheduling projects

Gant Chart in Project Management


Flowchart Symbols Accounting. Activity-based costing (ABC) flowchart

Gantt chart examples

Gantt Chart Software
Bar Diagrams for Problem Solving. Create event management bar charts with Bar Graphs Solution

How to Report Task's Execution with Gantt Chart

Functional Flow Block Diagram

"As a discipline, task management embraces several key activities. Various conceptual breakdowns exist, and these, at a high-level, always include creative, functional, project, performance and service activities.
Creative activities pertain to task creation. In context, these should allow for task planning, brainstorming, creation, elaboration, clarification, organization, reduction, targeting and preliminary prioritization.
Functional activities pertain to personnel, sales, quality or other management areas, for the ultimate purpose of ensuring production of final goods and services for delivery to customers. In context these should allow for planning, reporting, tracking, prioritizing, configuring, delegating, and managing of tasks.
Project activities pertain to planning and time and costs reporting. These can encompass multiple functional activities but are always greater and more purposeful than the sum of its parts. In context project activities should allow for project task breakdown, task allocation, inventory across projects, and concurrent access to task databases.
Service activities pertain to client and internal company services provision, including customer relationship management and knowledge management. In context these should allow for file attachment and links to tasks, document management, access rights management, inventory of client & employee records, orders & calls management, and annotating tasks.
Performance activities pertain to tracking performance and fulfillment of assigned tasks. In context these should allow for tracking by time, cost control, stakeholders and priority; charts, exportable reports, status updates, deadline adjustments, and activity logging.
Report activities pertain to the presentation of information regarding the other five activities listed, including graphical display." [Task management. Wikipedia]
The example "Project tasks dashboard" was created using the ConceptDraw PRO diagramming and vector drawing software extended with the Status Dashboard solution from the area "What is a Dashboard" of ConceptDraw Solution Park.
Project tasks dashboard

ConceptDraw PROJECT Project Management Software Tool

Metropolitan area networks (MAN). Computer and Network Examples
. Computer and Network Examples")

Swim Lane Flowchart Symbols

Examples of Flowcharts, Org Charts and More


- Graphs Chart On The Daily Activities Of A Student
- Graphs Charts About Time Allocation Of Daily Activities
- Graph The Time Allocation Of Students Daily Activities
- Graph And Chart The Time Allocation Of Students Daily Activities
- Graph Chart About A Students Daily Activity
- Graphs Charts Allocation Of Students Daily Activities
- Schedule pie chart - Daily action plan | Daily Schedule Chart ...
- Schedule pie chart - Daily action plan | Chart Examples | Basic ...
- Graph About Time Allocation For Daily Activities
- Time Allocation With Graph
- Schedule pie chart - Daily action plan | Basic Flowchart Symbols ...
- A Chart On The Time Allocation Of Students Daily Activities
- Showing The Graph Chart Daily Activities
- A Graph Or Chart About Daily Activities
- A Pie Charts On The Time Allocation Of Student Daly Activities ...
- Schedule pie chart - Daily action plan | Process Flowchart | Basic ...
- Daily Time Allocation Pie Chart
- Schedule pie chart - Daily action plan | Basic Flowchart Symbols ...
- Write On Chart The Time Allocation Of Students Dailly Activities
- Graph Or Charts With Weekend Activities