Bar Diagrams for Problem Solving. Create economics and financial bar charts with Bar Graphs Solution

How to Create Presentation of Your Project Gantt Chart

Chart Examples

 Pie Charts
Pie Charts are extensively used in statistics and business for explaining data and work results, in mass media for comparison (i.e. to visualize the percentage for the parts of one total), and in many other fields. The Pie Charts solution for ConceptDraw PRO v10 offers powerful drawing tools, varied templates, samples, and a library of vector stencils for simple construction and design of Pie Charts, Donut Chart, and Pie Graph Worksheets.
The 3D vertical bar graph sample shows the Iran internet users per 100 person from 2000 to 2011. It was designed on the base of the Commons Wikimedia file: Iran internet users per 100 person.png.
[commons.wikimedia.org/ wiki/ File:Iran_ internet_ users_ per_ 100_ person.png]
This file is licensed under the Creative Commons Attribution-Share Alike 3.0 Unported license. [creativecommons.org/ licenses/ by-sa/ 3.0/ deed.en]
The data source is World Bank: [data.worldbank.org/ country/ iran-islamic-republic]
"In 1993 Iran became the second country in the Middle East to be connected to the Internet, and since then the government has made significant efforts to improve the nation's ICT infrastructure. Iran's national Internet connectivity infrastructure is based on two major networks: the public switched telephone network (PSTN) and the public data network. The PSTN provides a connection for end-users to Internet service providers (ISPs) over mostly digital lines and supports modem-based connections. The Data Communication Company of Iran (DCI), a subsidiary of TCI, operates the public data network." [Internet in Iran. Wikipedia]
The 3D column chart example "Iran internet users per 100 person" was created using the ConceptDraw PRO diagramming and vector drawing software extended with the Bar Graphs solution from the Graphs and Charts area of ConceptDraw Solution Park.
3D Column chart

Chart Templates

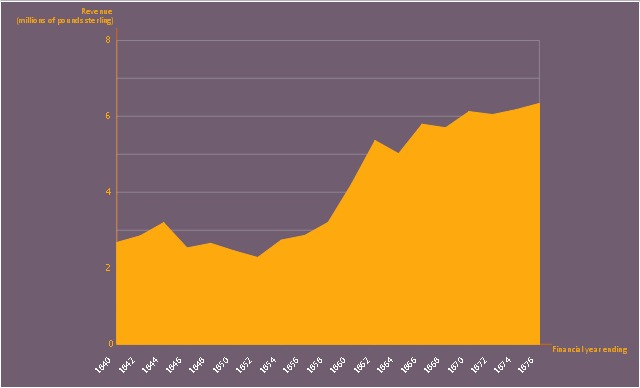
This area chart sample shows the revenue collected by the East India Company (after 1858 the British government) from salt (including inland and port taxes and sale of government salt). It was designed on the base of the Wikimedia Commons file: British India salt revenue 1840-1877.png.
[commons.wikimedia.org/ wiki/ File:British_ India_ salt_ revenue_ 1840-1877.png]
This file is licensed under the Creative Commons Attribution-Share Alike 3.0 Unported license. [creativecommons.org/ licenses/ by-sa/ 3.0/ deed.en]
"The Inland Customs Line which incorporated the Great Hedge of India (or Indian Salt Hedge[1]) was a customs barrier built by the British across India primarily to collect the salt tax. The customs line was begun while India was under the control of the East India Company but continued into the period of direct British rule. The line had its beginnings in a series of customs houses that were established in Bengal in 1803 to prevent the smuggling of salt to avoid the tax. These customs houses were eventually formed into a continuous barrier that was brought under the control of the Inland Customs Department in 1843." [Inland Customs Line. Wikipedia]
The area graph example "British India salt revenue 1840-1877" was created using the ConceptDraw PRO diagramming and vector drawing software extended with the Area Charts solution from the Graphs and Charts area of ConceptDraw Solution Park.
Area chart
Process Flowchart


Pyramid Diagram

Bar Chart Examples

Export from ConceptDraw PRO Document to a Graphic File


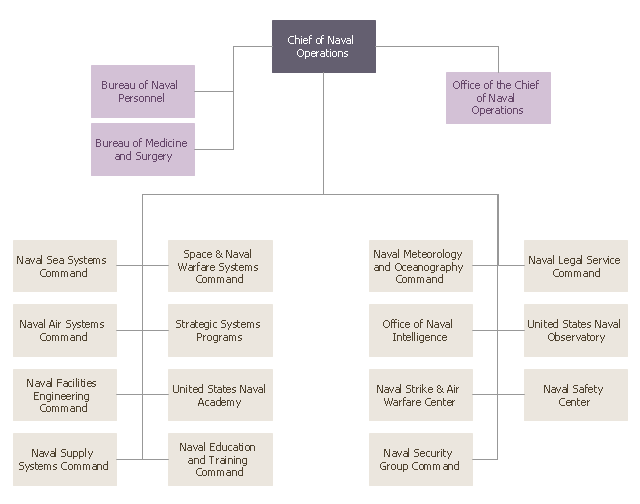
This organization chart example was redesigned from the Wikimedia Commons file: Us Navy Shore Establishment Org Chart.png. [commons.wikimedia.org/ wiki/ File:Us_ Navy_ Shore_ Establishment_ Org_ Chart.png]
"The shore establishment provides support to the operating forces (known as "the fleet") in the form of: facilities for the repair of machinery and electronics; communications centers; training areas and simulators; ship and aircraft repair; intelligence and meteorological support; storage areas for repair parts, fuel, and munitions; medical and dental facilities; and air bases." [navy.mil/ navydata/ organization/ org-shor.asp]
The org chart sample "US Navy shore establishment" was created using the ConceptDraw PRO diagramming and vector drawing software extended with the 25 Typical Organizational Charts solution from the Management area of ConceptDraw Solution Park.
Org chart
This organization chart example was redesigned from the Wikimedia Commons file: US Navy Operating Forces Org Chart.png. [commons.wikimedia.org/ wiki/ File:US_ Navy_ Operating_ Forces_ Org_ Chart.png]
"The operating forces commanders and fleet commanders have a dual chain of command. Administratively, they report to the Chief of Naval Operations and provide, train, and equip naval forces. Operationally, they provide naval forces and report to the appropriate Unified Combatant Commanders. Commander Fleet Forces Command commands and controls fleet assets on both the Atlantic and Pacific coasts for interdeployment training cycle purposes. As units of the Navy enter the area of responsibility for a particular Navy area commander, they are operationally assigned to the appropriate numbered fleet. All Navy units also have an administrative chain of command with the various ships reporting to the appropriate Type Commander." [navy.mil/ navydata/ organization/ orgopfor.asp]
The org chart sample "US Navy operating forces" was created using the ConceptDraw PRO diagramming and vector drawing software extended with the 25 Typical Organizational Charts solution from the Management area of ConceptDraw Solution Park.
Org chart

Basic Diagramming


- Pie Charts | DroidDia prime | Pie Chart Software | Circle Graph Png ...
- Horizontal Bar Graph Png
- Blue Bar Graph Png
- Pie Charts | Donut Chart | Chart Templates | Donut Chart Png
- Percentage Chart Png
- 3D Column chart - Iran internet users per 100 person | Bar Graphs ...
- White Doughnut Graph With Data Png Format
- Graph Logo Png
- Chart Pie Png
- Growth Chart Png
- 3d Bar Graph Horizontal Png
- Pie Charts | Pie Chart Examples and Templates | Circular diagrams ...
- Horizontal Bar Chart Png
- Beautiful Bar Chart Image Png
- Time Series Graph Png
- Pie Charts | European Parliament election | How to Create a Pie ...
- Graph Png
- Pie Charts | Pie Chart Examples and Templates | Pie Graph ...
- Line Chart Template for Word | Line Graph | Chart Maker for ...
- Growth Chart Png Vector