Chart Examples

Export from ConceptDraw PRO Document to a Graphic File


Chart Templates

How to Create Presentation of Your Project Gantt Chart

The 3D vertical bar graph sample shows the Iran internet users per 100 person from 2000 to 2011. It was designed on the base of the Commons Wikimedia file: Iran internet users per 100 person.png.
[commons.wikimedia.org/ wiki/ File:Iran_ internet_ users_ per_ 100_ person.png]
This file is licensed under the Creative Commons Attribution-Share Alike 3.0 Unported license. [creativecommons.org/ licenses/ by-sa/ 3.0/ deed.en]
The data source is World Bank: [data.worldbank.org/ country/ iran-islamic-republic]
"In 1993 Iran became the second country in the Middle East to be connected to the Internet, and since then the government has made significant efforts to improve the nation's ICT infrastructure. Iran's national Internet connectivity infrastructure is based on two major networks: the public switched telephone network (PSTN) and the public data network. The PSTN provides a connection for end-users to Internet service providers (ISPs) over mostly digital lines and supports modem-based connections. The Data Communication Company of Iran (DCI), a subsidiary of TCI, operates the public data network." [Internet in Iran. Wikipedia]
The 3D column chart example "Iran internet users per 100 person" was created using the ConceptDraw PRO diagramming and vector drawing software extended with the Bar Graphs solution from the Graphs and Charts area of ConceptDraw Solution Park.
3D Column chart

Bar Chart Template

Bar Diagrams for Problem Solving. Create economics and financial bar charts with Bar Graphs Solution

Emergency Plan


Gant Chart in Project Management


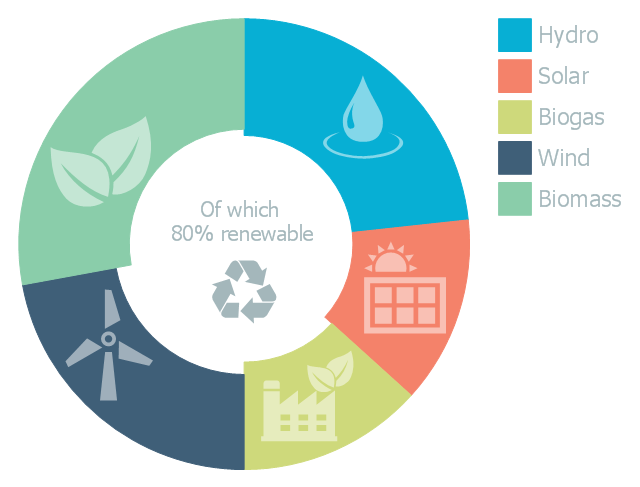
This doughnut chart sample illustrates the renewable energy sources. It was designed on the base of the Wikipedia file: Example of a doughnut chart.png.
[en.wikipedia.org/ wiki/ File:Example_ of_ a_ doughnut_ chart.png]
This file is licensed under the Creative Commons Attribution-ShareAlike 3.0 License. [creativecommons.org/ licenses/ by-sa/ 3.0/ ]
"Renewable energy is generally defined as energy that is collected from resources which are naturally replenished on a human timescale, such as sunlight, wind, rain, tides, waves, and geothermal heat. Renewable energy often provides energy in four important areas: electricity generation, air and water heating/ cooling, transportation, and rural (off-grid) energy services." [Renewable energy. Wikipedia]
The donut chart example "Renewable energy" was created using the ConceptDraw PRO diagramming and vector drawing software extended with the Pie Charts solutiton of the Graphs and Charts area in ConceptDraw Solution Park.
Donut chart
- Chart Templates | Pie Charts | Chart Examples | Percentage Chart Png
- Horizontal Bar Graph Png
- 3d Bar Graph Png
- Growth Graph Png
- Pie Charts | DroidDia prime | Pie Chart Software | Circle Graph Png ...
- Design elements - Financial charts | Finance Chart Image Png
- Logistics Flow Charts | Pie Charts | Blank Flow Chart Png
- 3d Bar Graph Horizontal Png
- Time Series Graph Png