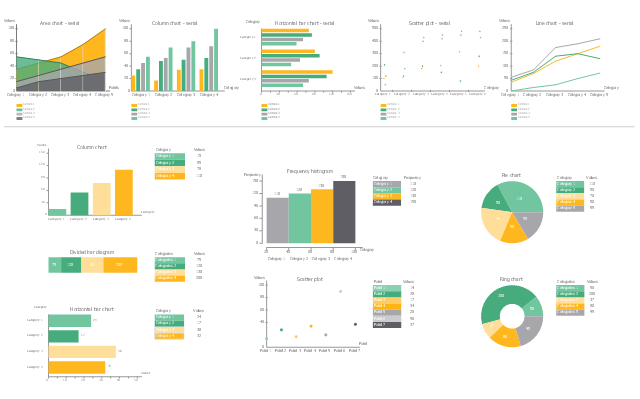
The vector stencils library "Financial charts" contains 12 charts and graphs.
"A chart, also called a graph, is a graphical representation of data, in which the data is represented by symbols, such as bars in a bar chart, lines in a line chart, or slices in a pie chart". A chart can represent tabular numeric data, functions or some kinds of qualitative structure and provides different info." [Chart. Wikipedia]
Use it to design your financial infographics.
Infographic elements