Bar Diagrams for Problem Solving. Create economics and financial bar charts with Bar Graphs Solution

Picture Graph

Chart Maker for Presentations

Rainfall Bar Chart

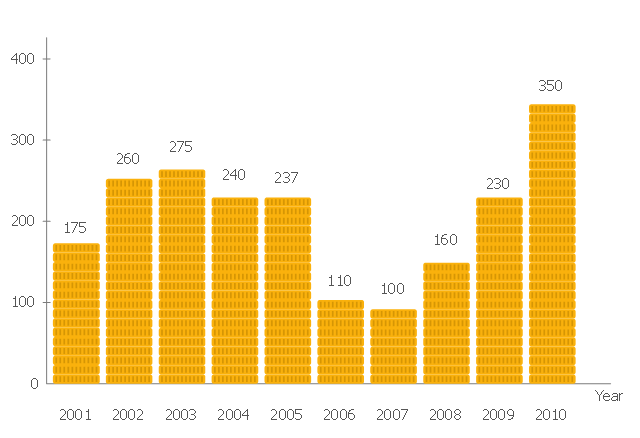
This image graph sample shows the total financing of the Philippines from 2001-2010. This pictorial bar chart was designed on the base of the Wikimedia Commons file: Financing-Total.png. [commons.wikimedia.org/ wiki/ File:Financing-Total.png]
This file is licensed under the Creative Commons Attribution-Share Alike 3.0 Unported license. [creativecommons.org/ licenses/ by-sa/ 3.0/ deed.en]
"The Economy of the Philippines is the 40th largest in the world, according to 2012 International Monetary Fund statistics, and is also one of the emerging markets in the world. The Philippines is considered as a newly industrialized country, which has been transitioning from being one based on agriculture to one based more on services and manufacturing. According to the World Bank ICP 2011, the estimated 2011 GDP (purchasing power parity) was $543.7 billion." [Economy of the Philippines. Wikipedia]
The image chart example "The total financing of the Philippines from 2001-2010" was created using the ConceptDraw PRO diagramming and vector drawing software extended with the Marketing Diagrams solution from the Marketing area of ConceptDraw Solution Park.
Marketing graph
How to Create Presentation of Your Project Gantt Chart

Bar Diagram Math

Bar Chart

Chart Templates

This picture bar graph sample shows the computer and Internet use at home from 1984 to 2014. It was designed using data from website of the United States Census Bureau (USCB).
[census.gov/ content/ dam/ Census/ library/ visualizations/ 2016/ comm/ digital_ nation.png]
"Home automation is the residential extension of building automation and involves the control and automation of lighting, heating, ventilation, air conditioning (HVAC), appliances, and security. Modern systems generally consist of switches and sensors connected to a central hub sometimes called a "gateway" from which the system is controlled with a user interface that is interacted either with a wall-mounted terminal, mobile phone software, tablet computer or a web interface." [Home automation. Wikipedia]
The pictorial chart example "Computer and Internet use at home over time" was created using the ConceptDraw PRO diagramming and vector drawing software extended with the Picture Graphs solution from the Graphs and Charts area of ConceptDraw Solution Park.
Image chart

- Design elements - Financial charts | Finance Chart Image Png
- Separator Line Image In Png
- Seperator Png
- Chart Examples | Sales Growth. Bar Graphs Example | Business ...
- Progress Bar Images Png
- Barrie population - Picture bar graph | Computer and Internet use at ...
- Circle Graph Png Images
- Website Slider Bar Png
- Vertical Line Image Png
- Back Button Image Png