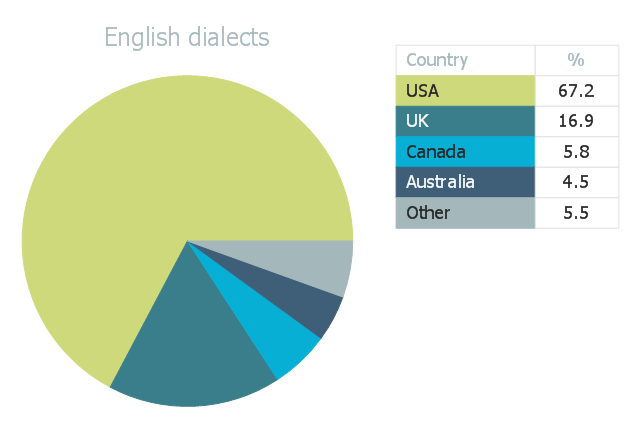
This pie chart sample shows the shares of the main English speaking countries in the total population of native English speakers in 1997. Only real native speakers are counted.
This pie chart example was designed on the base of the Wikimedia Commons file: English dialects1997.png. [commons.wikimedia.org/ wiki/ File:English_ dialects1997.png]
The pie chart example "English dialects" was created using the ConceptDraw PRO diagramming and vector drawing software extended with the Pie Charts solution of the Graphs and Charts area in
ConceptDraw Solution Park.
Pie chart
HelpDesk
How to Draw a Pie Chart

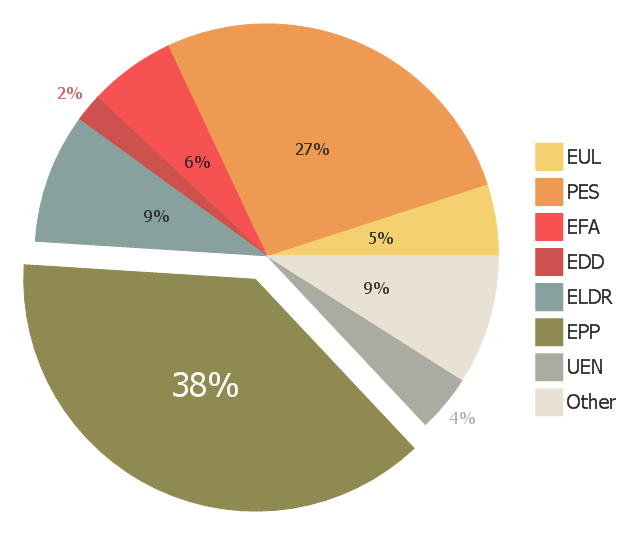
This exploded pie chart example shows the ''preliminary'' results from the 2004 European Parliament election. It was designed on the base of the Wikimedia Commons file: Pie chart EP election 2004 exploded.png. [commons.wikimedia.org/ wiki/ File:Pie_ chart_ EP_ election_ 2004_ exploded.png].
This file is available under the Creative Commons Attribution-ShareAlike 3.0 Unported License. [creativecommons.org/ licenses/ by-sa/ 3.0/ ].
"Elections to the European Parliament take place every five years by universal adult suffrage. 751 MEPs (Members of the European Parliament) are elected to the European Parliament which has been directly elected since 1979. No other EU institution is directly elected, with the Council of the European Union and the European Council being only indirectly legitimated through national elections. While Europarties have the right to campaign EU-wide for the European elections, campaigns are still taking place through national election campaigns, advertising national delegates from national parties." [Elections to the European Parliament. Wikipedia]
The exploded pie chart example "European Parliament election" was created using the ConceptDraw PRO diagramming and vector drawing software extended with the Pie Charts solution of the Graphs and Charts area in ConceptDraw Solution Park.
Exploded pie chart
 Pie Charts
Pie Charts are extensively used in statistics and business for explaining data and work results, in mass media for comparison (i.e. to visualize the percentage for the parts of one total), and in many other fields. The Pie Charts solution for ConceptDraw DIAGRAM offers powerful drawing tools, varied templates, samples, and a library of vector stencils for simple construction and design of Pie Charts, Donut Chart, and Pie Graph Worksheets.
Percentage Pie Chart. Pie Chart Examples

Pie Chart Software

Pie Chart Word Template. Pie Chart Examples

Chart Maker for Presentations

Pie Chart Examples and Templates

Chart Templates

- Chart Templates | Pie Charts | Chart Examples | Percentage Chart Png
- Pie Charts | Pie Chart Examples and Templates | Circular diagrams ...
- Exploded pie chart - European Parliament election | European ...
- Raining Diagram Png
- Juice bar | Pie Charts | F&B | Juices Infographic Png
- Sector weightings - Exploded pie chart | Chart Templates | Pie Chart ...
- Project management - Vector stencils library | Schedule pie chart ...
- Exploded pie chart
- U.S. Medicare spending per capita | Process Flowchart | Pie Charts ...
- European Parliament election | Pie Charts | Pie Chart Of Parliament