This Azure cloud architecture pattern diagram template was created on the base of figure in the article "External Configuration Store Pattern" from the Microsoft Developer Network (MSDN) website.
"External Configuration Store Pattern.
Move configuration information out of the application deployment package to a centralized location. This pattern can provide opportunities for easier management and control of configuration data, and for sharing configuration data across applications and application instances. ...
The majority of application runtime environments include configuration information that is held in files deployed with the application, located within the application folders. In some cases it is possible to edit these files to change the behavior of the application after it has been deployed. However, in many cases, changes to the configuration require the application to be redeployed, resulting in unacceptable downtime and additional administrative overhead. ...
Store the configuration information in external storage, and provide an interface that can be used to quickly and efficiently read and update configuration settings. The type of external store depends on the hosting and runtime environment of the application. In a cloud-hosted scenario it is typically a cloud-based storage service, but could be a hosted database or other system.
The backing store chosen for configuration information should be fronted by a suitable interface that provides consistent and easy to use access in a controlled way that enables reuse. Ideally, it should expose the information in a correctly typed and structured format. The implementation may also need to authorize users’ access in order to protect configuration data, and be flexible enough to allow multiple versions of the configuration (such as development, staging, or production, and multiple release versions of each one) to be stored." [msdn.microsoft.com/ ru-RU/ library/ dn589803.aspx]
The Azure cloud system architecture diagram template "External Configuration Store Pattern" for the ConceptDraw PRO diagramming and vector drawing software is included in the Azure Architecture solutin from the Computer and Networks area of ConceptDraw Solution Park.
Cloud computing system architecture diagram template

Fishbone Diagram Procedure

Cisco Products Additional. Cisco icons, shapes, stencils and symbols

Express-G Diagram

 Fishbone Diagrams
The Fishbone Diagrams solution extends ConceptDraw DIAGRAM software with the ability to easily draw the Fishbone Diagrams (Ishikawa Diagrams) to clearly see the cause and effect analysis and also problem solving. The vector graphic diagrams produced using this solution can be used in whitepapers, presentations, datasheets, posters, and published technical material.
Pyramid Diagram

Electrical Circuits — Electrical Symbols

 IDEF Business Process Diagrams
The IDEF Business Process Diagrams solution can help the ConceptDraw DIAGRAM users create the needed IDEF business process diagrams by providing them with useful drawing tools, the stencils meaning the design symbols including the connectors, IDEF design elements. These tools help users to create the great looking business process diagrams based on the IDEF methodology, effective database designs and object-oriented designs, following the integration definition methodology. Being suitable for any user who needs to capture or to record different business processes and the system architecture, IDEF Business Process Diagrams solution is useful for many IT specialists, computer specialists, network and telecommunication engineers, IT managers, software engineers, system administrators, webmasters, system architects, and system engineers, etc.
 EXPRESS-G data Modeling Diagram
EXPRESS-G data Modeling Diagram solution extends the ConceptDraw DIAGRAM software functionality with capabilities of EXPRESS data modeling language, includes powerful data modeling tools, Express-G diagram tool, database diagram tool, database design tool, wide variety of pre-made vector objects of EXPRESS-G notation and EXPRESS-G diagrams samples allowing software developers, software designers, software engineers and other stakeholders to make their data models for information systems, to develop the databases, to learn the principles of construction EXPRESS-G diagrams and helping to draw their own EXPRESS-G Data Modeling Diagrams, Express-G Diagrams or Database Model Diagram without any efforts.
Electrical Schematic

This circle diagram sample was redesigned from the Wikimedia Commons file: Research cycle.png. "Some of the basic elements of the scientific method, arranged in a cycle to emphasize that it is an iterative process." [commons.wikimedia.org/ wiki/ File:Research_ cycle.png]
This file is licensed under the Creative Commons Attribution 2.0 Generic license. [creativecommons.org/ licenses/ by/ 2.0/ deed.en]
"The scientific method is a body of techniques for investigating phenomena, acquiring new knowledge, or correcting and integrating previous knowledge. To be termed scientific, a method of inquiry must be based on empirical and measurable evidence subject to specific principles of reasoning. ...
Four essential elements of the scientific method are iterations, recursions, interleavings, or orderings of the following:
(1) Characterizations (observations, definitions, and measurements of the subject of inquiry).
(2) Hypotheses (theoretical, hypothetical explanations of observations and measurements of the subject).
(3) Predictions (reasoning including logical deduction from the hypothesis or theory).
(4) Experiments (tests of all of the above)...
A linearized, pragmatic scheme of the four points above is sometimes offered as a guideline for proceeding:
(1) Define a question.
(2) Gather information and resources (observe).
(3) Form an explanatory hypothesis.
(4) Test the hypothesis by performing an experiment and collecting data in a reproducible manner.
(5) Analyze the data.
(6) Interpret the data and draw conclusions that serve as a starting point for new hypothesis.
(7) Publish results.
(8) Retest (frequently done by other scientists).
The iterative cycle inherent in this step-by-step method goes from point 3 to 6 back to 3 again." [Scientific method. Wikipedia]
The circle diagram example "Research cycle" was created using the ConceptDraw PRO diagramming and vector drawing software extended with the Target and Circular Diagrams solution from the Marketing area of ConceptDraw Solution Park.
www.conceptdraw.com/ solution-park/ marketing-target-and-circular-diagrams
Circle diagram

 Network Layout Floor Plans
Network Layout Floor Plans solution extends ConceptDraw DIAGRAM software functionality with powerful tools for quick and efficient documentation the network equipment and displaying its location on the professionally designed Network Layout Floor Plans. Never before creation of Network Layout Floor Plans, Network Communication Plans, Network Topologies Plans and Network Topology Maps was not so easy, convenient and fast as with predesigned templates, samples, examples and comprehensive set of vector design elements included to the Network Layout Floor Plans solution. All listed types of plans will be a good support for the future correct cabling and installation of network equipment.
Cisco Multimedia, Voice, Phone. Cisco icons, shapes, stencils and symbols

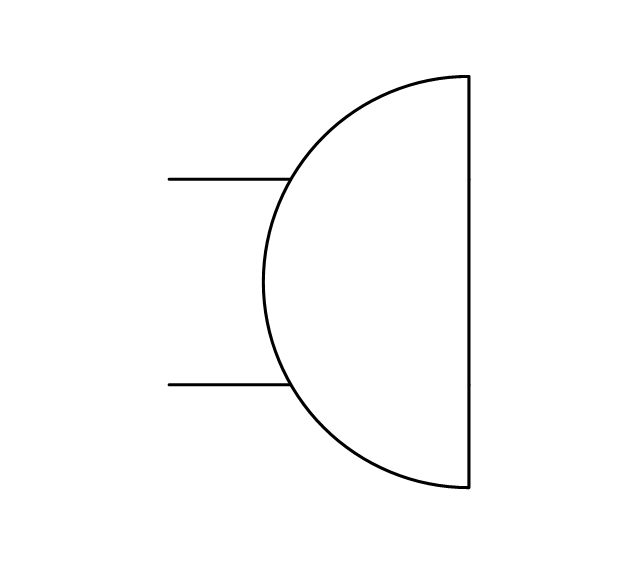
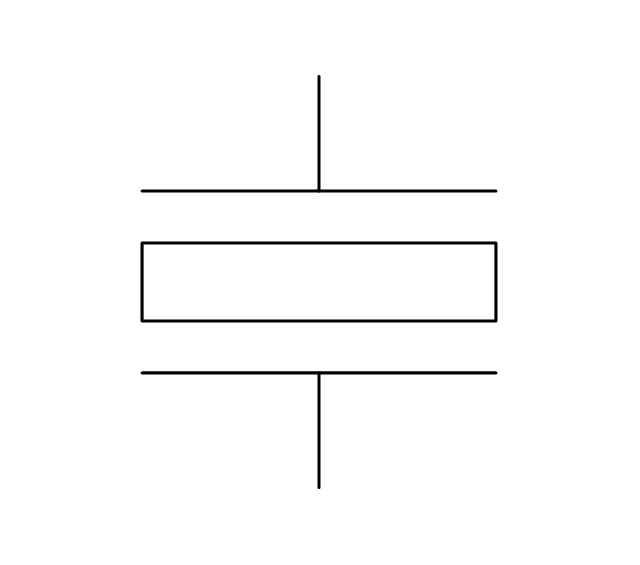
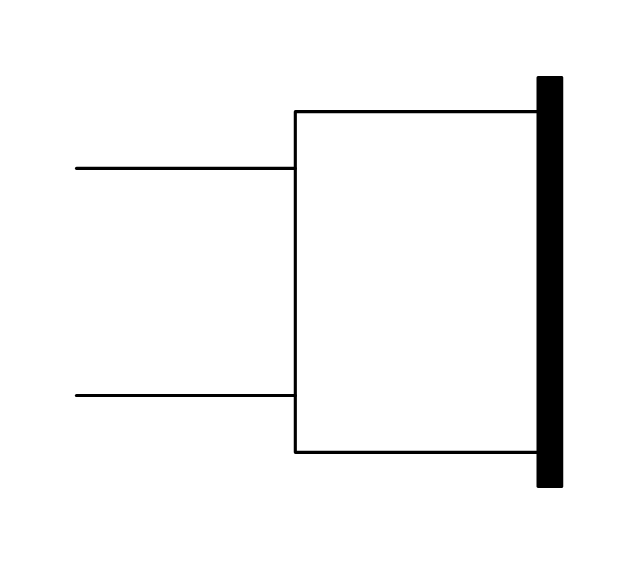
The vector stencils library "Video and audio" contains 50 symbols of devices and equipment.
Use it for drawing audio and video system layouts, cabling floor plans, electrical circuit schematic and wiring diagrams in the ConceptDraw PRO diagramming and vector drawing software.
The vector stencils library "Video and audio" is included in the Electric and Telecom Plans solution from the Building Plans area of ConceptDraw Solution Park.
Audio amplifier

RF amplifier
Video amplifier

Generic automatic switcher
Generic A/V switcher
Generic source component

System components

Headphone jack
Infrared receiver
Infrared transmitter
Music keypad
Mono speaker outlet
Stereo speaker outlet
Speaker ceiling

Speaker in-wall
Speaker subwoofer
Speaker weatherproof
Buzzer and bleeper
Piezo transducer
Microphone

Earphone
Cable antenna outlet

Master antenna outlet

Volume control
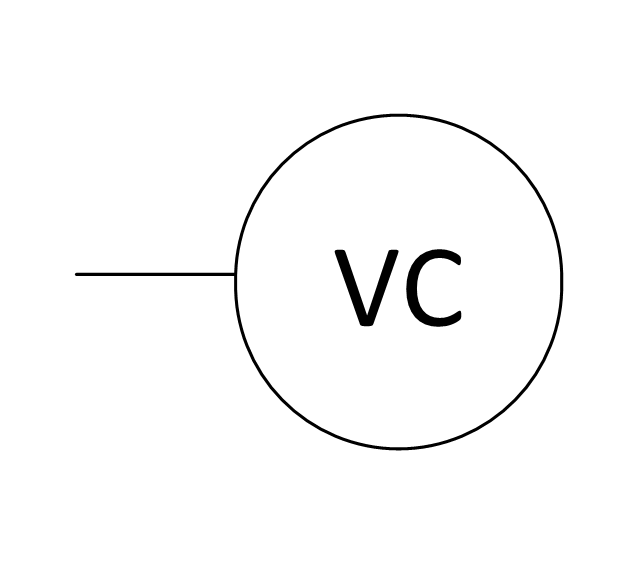
Volume control
Flush mounted intercom unit

Master intercom and directory unit

Floor mounted microphone outlet
Wall mounted microphone outlet
Ceiling mounted speaker
Speaker horn
Wall mounted speaker

Call in switch
Ceiling mounted paging speaker
Wall mounted paging speaker
Flush mounted data floor outlet
Flush mounted data floor outlet

Flush mounted data / telephone floor outlet

Surface mounted data floor outlet
Surface mounted data floor outlet

Surface mounted data / telephone floor outlet

Data outlet
Telephone outlet

Telephone, data outlet

Wall mounted telephone outlet

Equipment cabinet

Free standing equipment rack
Plywood backboard
Terminal cabinet with plywood backing
Wall mounted equipment rack

 Matrices
This solution extends ConceptDraw DIAGRAM software with samples, templates and library of design elements for drawing the business matrix diagrams.
SWOT Analysis Solution - Strategy Tools

 Venn Diagrams
Venn Diagrams are actively used to illustrate simple set relationships in set theory and probability theory, logic and statistics, mathematics and computer science, linguistics, sociology, and marketing. Venn Diagrams are also often used to visually summarize the status and future viability of a project.
 Computers and Communications
Computers and communications solution extends ConceptDraw DIAGRAM software with illustration samples, templates and vector stencils libraries with clip art of computers, control devices, communications, technology, Apple machines.
 Seven Basic Tools of Quality
Seven Basic Tools of Quality solution is useful for all ConceptDraw DIAGRAM users, giving them a particular set of different graphical techniques helping on focus on such activity as identifying the root cause of many quality-related issues. This solution offers the well-known visual tools helpful in representing all the data related to different quality initiatives. Some of such tools are the pre-made templates useful for making different fishbone diagrams, Pareto charts, and histograms. It is ideal for all who want to manage quality control throughout an organization by using a modern tool.
Entity Relationship Software

- Porter's generic strategies matrix diagram | Block diagram - Porter's ...
- External configuration store pattern | AWS Architecture Diagrams
- Fishbone Diagrams | Generic Workflow Diagram Example
- Health endpoint monitoring pattern | Database Block Diagram Generic
- Accounting Flowchart Symbols | Symbol Of General Ledger
- Accounts Payable Process Flow Chart | Generic Flow Chart
- Electrical Symbols, Electrical Diagram Symbols | UML Class ...
- Porter's generic strategies matrix diagram | Competitive strategy ...
- Data Flow Diagram | Work Order Process Flowchart. Business ...
- Design elements - AWS General | Flow Chart Online