This Azure cloud architecture pattern diagram template was created on the base of figure in the article "Health Endpoint Monitoring Pattern" from the Microsoft Developer Network (MSDN) website.
"Health Endpoint Monitoring Pattern.
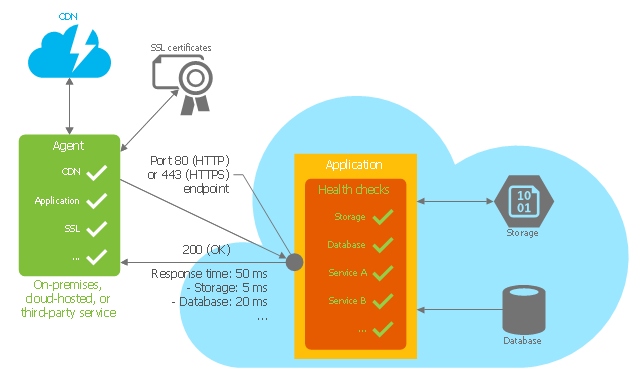
Implement functional checks within an application that external tools can access through exposed endpoints at regular intervals. This pattern can help to verify that applications and services are performing correctly. ...
It is good practice—and often a business requirement—to monitor web applications, and middle-tier and shared services, to ensure that they are available and performing correctly. However, it is more difficult to monitor services running in the cloud than it is to monitor on-premises services. ...
Implement health monitoring by sending requests to an endpoint on the application. The application should perform the necessary checks, and return an indication of its status.
A health monitoring check typically combines two factors: the checks (if any) performed by the application or service in response to the request to the health verification endpoint, and analysis of the result by the tool or framework that is performing the health verification check. The response code indicates the status of the application and, optionally, any components or services it uses. The latency or response time check is performed by the monitoring tool or framework." [msdn.microsoft.com/ ru-RU/ library/ dn589789.aspx]
The Azure cloud system architecture diagram template "Health endpoint monitoring pattern" for the ConceptDraw PRO diagramming and vector drawing software is included in the Azure Architecture solutin from the Computer and Networks area of ConceptDraw Solution Park.
"Health Endpoint Monitoring Pattern.
Implement functional checks within an application that external tools can access through exposed endpoints at regular intervals. This pattern can help to verify that applications and services are performing correctly. ...
It is good practice—and often a business requirement—to monitor web applications, and middle-tier and shared services, to ensure that they are available and performing correctly. However, it is more difficult to monitor services running in the cloud than it is to monitor on-premises services. ...
Implement health monitoring by sending requests to an endpoint on the application. The application should perform the necessary checks, and return an indication of its status.
A health monitoring check typically combines two factors: the checks (if any) performed by the application or service in response to the request to the health verification endpoint, and analysis of the result by the tool or framework that is performing the health verification check. The response code indicates the status of the application and, optionally, any components or services it uses. The latency or response time check is performed by the monitoring tool or framework." [msdn.microsoft.com/ ru-RU/ library/ dn589789.aspx]
The Azure cloud system architecture diagram template "Health endpoint monitoring pattern" for the ConceptDraw PRO diagramming and vector drawing software is included in the Azure Architecture solutin from the Computer and Networks area of ConceptDraw Solution Park.
Cloud computing system architecture diagram template
Structured Systems Analysis and Design Method (SSADM) with ConceptDraw DIAGRAM

Entity Relationship Diagram Examples


This Azure cloud architecture pattern diagram template was created on the base of figure in the article "Health Endpoint Monitoring Pattern" from the Microsoft Developer Network (MSDN) website.
"Health Endpoint Monitoring Pattern.
Implement functional checks within an application that external tools can access through exposed endpoints at regular intervals. This pattern can help to verify that applications and services are performing correctly. ...
It is good practice—and often a business requirement—to monitor web applications, and middle-tier and shared services, to ensure that they are available and performing correctly. However, it is more difficult to monitor services running in the cloud than it is to monitor on-premises services. ...
Implement health monitoring by sending requests to an endpoint on the application. The application should perform the necessary checks, and return an indication of its status.
A health monitoring check typically combines two factors: the checks (if any) performed by the application or service in response to the request to the health verification endpoint, and analysis of the result by the tool or framework that is performing the health verification check. The response code indicates the status of the application and, optionally, any components or services it uses. The latency or response time check is performed by the monitoring tool or framework." [msdn.microsoft.com/ ru-RU/ library/ dn589789.aspx]
The Azure cloud system architecture diagram template "Health endpoint monitoring pattern" for the ConceptDraw PRO diagramming and vector drawing software is included in the Azure Architecture solutin from the Computer and Networks area of ConceptDraw Solution Park.
Cloud computing system architecture diagram template
Electrical Symbols, Electrical Diagram Symbols

Business Diagram Software


 AWS Architecture Diagrams
AWS Architecture Diagrams with powerful drawing tools and numerous predesigned Amazon icons and AWS simple icons is the best for creation the AWS Architecture Diagrams, describing the use of Amazon Web Services or Amazon Cloud Services, their application for development and implementation the systems running on the AWS infrastructure. The multifarious samples give you the good understanding of AWS platform, its structure, services, resources and features, wide opportunities, advantages and benefits from their use; solution’s templates are essential and helpful when designing, description and implementing the AWS infrastructure-based systems. Use them in technical documentation, advertising and marketing materials, in specifications, presentation slides, whitepapers, datasheets, posters, etc.
 Azure Architecture
Azure Architecture solution bundles into one handy tool everything you need to create effective Azure Architecture diagrams. It adds the extra value to versatile ConceptDraw DIAGRAM software and extends the users capabilities with comprehensive collection of Microsoft Azure themed graphics, logos, preset templates, wide array of predesigned vector symbols that covers the subjects such as Azure management, Azure storage, and Azure services, amongst others, and allow you to illustrate Azure Architecture diagrams at any degree of complexity, to present visually your Azure cloud system architecture with professional style, to design Azure cloud topology, to document Windows Azure Architecture and Azure Cloud System Architecture, to visualize the great abilities and work of Microsoft Azure Cloud System and Azure services.
How to show a mind map presentation via Skype
 Computer Network Diagrams
Computer Network Diagrams solution extends ConceptDraw DIAGRAM software with samples, templates and libraries of vector icons and objects of computer network devices and network components to help you create professional-looking Computer Network Diagrams, to plan simple home networks and complex computer network configurations for large buildings, to represent their schemes in a comprehensible graphical view, to document computer networks configurations, to depict the interactions between network's components, the used protocols and topologies, to represent physical and logical network structures, to compare visually different topologies and to depict their combinations, to represent in details the network structure with help of schemes, to study and analyze the network configurations, to communicate effectively to engineers, stakeholders and end-users, to track network working and troubleshoot, if necessary.
 IDEF Business Process Diagrams
Use the IDEF Business Process Diagrams solution to create effective database designs and object-oriented designs, following the integration definition methodology.
Network Topologies


 Rapid UML
Rapid UML solution extends ConceptDraw DIAGRAM software with templates, samples and libraries of vector stencils for quick drawing the UML diagrams using Rapid Draw technology.
 Business Process Mapping
The Business Process Mapping solution for ConceptDraw DIAGRAM is for users involved in process mapping and creating SIPOC diagrams.
 Sales Flowcharts
The Sales Flowcharts solution lets you create and display sales process maps, sales process workflows, sales steps, the sales process, and anything else involving sales process management.
- UML Block Diagram | About UML | Software and Database Design ...
- Entity Relationship Diagram Symbols | UML Class Diagram ...
- Cubetto Flowchart | Database Design | Building Drawing Design ...
- Block diagram - Porter's five forces model | Entity-Relationship ...
- Pyramid Diagram | Data Flow Diagram Model | Block diagram - Gap ...
- Generic Data Diagram
- Architecture Diagrams | Cloud Computing Architecture Diagrams ...
- Entity Relationship Diagram Symbols | UML Diagram | Database ...
- Block diagram - Porter's five forces model | SWOT analysis matrix ...
- Server hardware - Rack diagram | UML component diagram - Start ...
- Block Diagrams | UML Block Diagram | Functional Block Diagram ...
- Porter five forces model | Block diagram - Porter's five forces model ...
- 4 Level pyramid model diagram - Information systems types ...
- Competitor Analysis | Block diagram - Porter's five forces model ...
- Process Flowchart | Block diagram - Branding strategies | Functional ...
- Block diagram - Porter's five forces model | Block diagram - Porter's ...
- Uml Database Update
- Block diagram - Porter's five forces model | Block diagram - Six ...
- 5 Level pyramid model diagram - Information systems types | Block ...
- Block Diagrams | ConceptDraw Solution Park | Telecommunication ...