HelpDesk
How to Draw a Gantt Chart

Examples of Flowcharts, Org Charts and More


HelpDesk
How to Customize Columns in Your Project Schedule

HelpDesk
How to Create a Gantt Chart for Your Project

 Business Processes
Business Process solution extends ConceptDraw DIAGRAM software with business process diagrams as cross-functional flowcharts, workflows, process charts, IDEF0, timelines, calendars, Gantt charts, business process modeling, audit and opportunity flowcharts.
How to Discover Critical Path on a Gantt Chart

How to Create Presentation of Your Project Gantt Chart

Gant Chart in Project Management


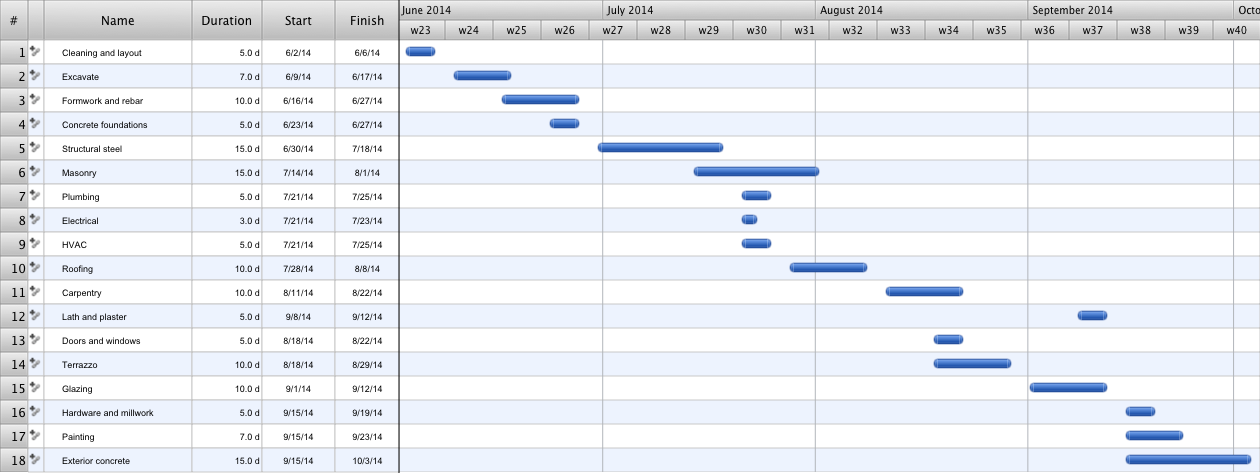
Gantt chart examples

How to Report Task's Execution with Gantt Chart

Construction Project Chart Examples
HelpDesk
How to Make a Mind Map from a Project Gantt Chart

What is Gantt Chart (historical reference)

Gantt charts for planning and scheduling projects

How To Plan and Implement Projects Faster

- Gantt Chart For Computer Network Project
- Strategic Goals For New Business Gantt Chart
- Booch OOD Diagram | Gantt chart examples | Gant Chart in Project ...
- Gantt Chart Of Business Activities Example
- Successful Strategic Plan | Computer Hardware - Reseller Business ...
- Hand Made Chart In Computer
- Gantt Chart Templates | How To Convert a Business Process ...
- Gantt Chart For Catering Company
- Business diagrams & Org Charts with ConceptDraw PRO | Gantt ...
- Gantt Chart Templates | ConceptDraw PROJECT Project ...
- Difference Between Gantt Chart And Process Flow Chart
- How to Create Presentation of Your Project Gantt Chart | Activity ...
- Gantt chart examples | Organizational Charts | Security and Access ...
- How to Draw a Gantt Chart Using ConceptDraw PRO | How to ...
- Example Gantt Chart For Business Start Up
- Gantt Chart Of A Service Business
- Gantt chart examples | Gant Chart in Project Management | How to ...
- How to Create Gantt Chart | How to Draw a Gantt Chart Using ...
- How to Create Presentation of Your Project Gantt Chart | SWOT ...
- Gant Chart in Project Management | Gantt chart examples | How to ...