How to Create Presentation of Your Project Gantt Chart

SWOT Sample in Computers

Process Flowchart


Lean Manufacturing Diagrams
 design elements")
Basic Audit Flowchart. Flowchart Examples

 Value Stream Mapping
Value stream mapping solution extends ConceptDraw PRO software with templates, samples and vector stencils for drawing the Value Stream Maps (VSM) in lean manufacturing practice.
Gant Chart in Project Management


Pyramid Chart Examples

Basic Flowchart Symbols and Meaning


This value stream map example was redesigned from the Wikipedia file: ValueStreamMapParts.png.
[en.wikipedia.org/ wiki/ File:ValueStreamMapParts.png]
This file is licensed under the Creative Commons Attribution-Share Alike 3.0 Unported license. [creativecommons.org/ licenses/ by-sa/ 3.0/ deed.en]
"Value stream mapping (VSM) refers to the activity of developing a visual representation of the flow of processes, from start to finish, involved in delivering a desired outcome, service, or product (a “value stream”) that is valued by customers. In the context of government, a value stream could be the process of conducting an audit, completing a procurement, or hiring new agency staff. VSM can increase understanding of actual decision-making processes and identify sources of non-value-added time (e.g., documents waiting to be reviewed). The typical products of a 2-5 day VSM workshop are a map of the “current state” of targeted processes and a “future state” map of the desired process flow and an associated implementation plan for future process improvement activities." [en.wikibooks.org/ wiki/ Business_ Analysis_ Guidebook/ LEAN]
The VSM diagram example "Value stream map parts" was created using the ConceptDraw PRO diagramming and vector drawing software extended with the Value Stream Mapping solution from the Quality area of ConceptDraw Solution Park.
Value stream mapping

 Entity-Relationship Diagram (ERD)
Entity-Relationship Diagram (ERD) solution extends ConceptDraw PRO software with templates, samples and libraries of vector stencils from drawing the ER-diagrams by Chen's and crow’s foot notations.
This circle-spoke diagram sample shows the Porter five forces model. It was designed on the base of the Wikimedia Commons file: Modelo Porter.png. [commons.wikimedia.org/ wiki/ File:Modelo_ Porter.png]
"Porter's five forces analysis is a framework that attempts to analyze the level of competition within an industry and business strategy development. It draws upon industrial organization (IO) economics to derive five forces that determine the competitive intensity and therefore attractiveness of an Industry. Attractiveness in this context refers to the overall industry profitability. An "unattractive" industry is one in which the combination of these five forces acts to drive down overall profitability. A very unattractive industry would be one approaching "pure competition", in which available profits for all firms are driven to normal profit. This analysis is associated with its principal innovator Michael E. Porter of Harvard University. ...
Porter's five forces include – three forces from 'horizontal' competition: the threat of substitute products or services, the threat of established rivals, and the threat of new entrants; and two forces from 'vertical' competition: the bargaining power of suppliers and the bargaining power of customers." [Porter's five forces analysis. Wikipedia]
The hub-and-spoke diagram example "Porter five forces model" was created using the ConceptDraw PRO diagramming and vector drawing software extended with the Circle-Spoke Diagrams solution from the area "What is a Diagram" of ConceptDraw Solution Park.
Circle-spoke diagram

This cloud computing diagram example was drawn on the base of Wikimedia Commons file: CloudMarketingDiagram.png. [commons.wikimedia.org/ wiki/ File:CloudMarketingDiagram.png]
This file is licensed under the Creative Commons Attribution 3.0 Unported license. [creativecommons.org/ licenses/ by/ 3.0/ deed.en]
"Cloud marketing is the process of an organisations efforts to market their goods and services online through integrated digital experiences, by which they are specialised for every single end user. The aim is to use advertising methods to target customers via online applications through social media websites such as Facebook, Twitter and various online portals to target consumers. Cloud marketing platforms are supported with third parties which maintain the platform." [Cloud marketing. Wikipedia]
The example "Cloud marketing diagram" was drawn using ConceptDraw PRO software extended with the Cloud Computing Diagrams solution from the Computer and Networks area of ConceptDraw Solution Park.
Cloud computing diagram example
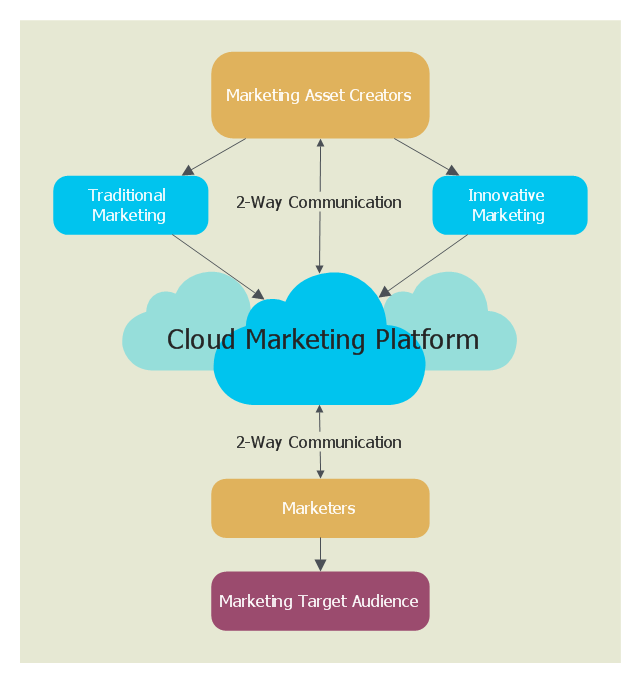
Chart Examples

- Customer Service Png Icons
- Customer Supporr Vector Png
- Employee Png
- Service Technician Icon Png
- Truck Vector Png
- Warehouse Vector Png
- Bank Vector Png
- Vector Growth Png
- Person Vector Png
- Customer On Line Vector Png
- Iphone Notes Icon Png
- Png Reception
- Payment Vector Png
- Career Vector Png
- Telephone Interactive Png
- Person For Diagram Png
- Logistic Truck Vector Png
- Business Person Clipart Png
- Career Pictogram Png
- Business To Customers Chart