 ConceptDraw Solution Park
ConceptDraw Solution Park collects graphic extensions, examples and learning materials
Business Diagram Software


 Universal Diagramming Area
This area collects solutions for drawing diagrams, charts, graphs, matrices, geographic and road maps for education, science, engineering, business.
 Biology
Biology solution extends ConceptDraw PRO software with samples, templates and libraries containing biological vector symbols, to help you create scientific and educational designs in the field of biology.
 Value Stream Mapping
Value stream mapping solution extends ConceptDraw PRO software with templates, samples and vector stencils for drawing the Value Stream Maps (VSM) in lean manufacturing practice.
 Computer and Networks Area
The solutions from Computer and Networks Area of ConceptDraw Solution Park collect samples, templates and vector stencils libraries for drawing computer and network diagrams, schemes and technical drawings.
 Event-driven Process Chain Diagrams
Event-driven Process Chain (EPC) Diagram is a type of flowchart widely used for modeling in business engineering and reengineering, business process improvement, and analysis. EPC method was developed within the Architecture of Integrated Information Systems (ARIS) framework.
Types of Flowchart - Overview


 Entity-Relationship Diagram (ERD)
An Entity-Relationship Diagram (ERD) is a visual presentation of entities and relationships. That type of diagrams is often used in the semi-structured or unstructured data in databases and information systems. At first glance ERD is similar to a flowch
 Fishbone Diagrams
The Fishbone Diagrams solution extends ConceptDraw PRO v10 software with the ability to easily draw the Fishbone Diagrams (Ishikawa Diagrams) to clearly see the cause and effect analysis and also problem solving. The vector graphic diagrams produced using this solution can be used in whitepapers, presentations, datasheets, posters, and published technical material.
 Fault Tree Analysis Diagrams
This solution extends ConceptDraw PRO v9.5 or later with templates, fault tree analysis example, samples and a library of vector design elements for drawing FTA diagrams (or negative analytical trees), cause and effect diagrams and fault tree diagrams.
 Total Quality Management TQM Diagrams
Total Quality Management Diagrams solution extends ConceptDraw PRO software with samples, templates and vector stencils library for drawing the TQM flowcharts.
 Block Diagrams
Block diagrams solution extends ConceptDraw PRO software with templates, samples and libraries of vector stencils for drawing the block diagrams.
 Workflow Diagrams
Workflow Diagrams solution extends ConceptDraw PRO software with samples, templates and vector stencils library for drawing the work process flowcharts.
 PM Easy
PM Easy solution extends the ConceptDraw PROJECT functionality with an ability to support neutral methodology of project management and to quickly start a project by listing the task relationships and dependencies, that makes the iterative planning much easier. The project management tool and available visual tools, such as mind mapping, increase the effectiveness of tracking and analysis your project tasks. PM Easy solution from ConceptDraw Solution Park is mainly targeted at project managers in small or medium-sized companies, allowing them to make the project plan and execute projects using mind mapping technique, to implement planning using mind mapping, and to track tasks using ConceptDraw PROJECT application.
 Data Flow Diagrams (DFD)
Data Flow Diagrams solution extends ConceptDraw PRO software with templates, samples and libraries of vector stencils for drawing the data flow diagrams (DFD).
 Enterprise Architecture Diagrams
Enterprise Architecture Diagrams solution extends ConceptDraw PRO software with templates, samples and library of vector stencils for drawing the diagrams of enterprise architecture models.
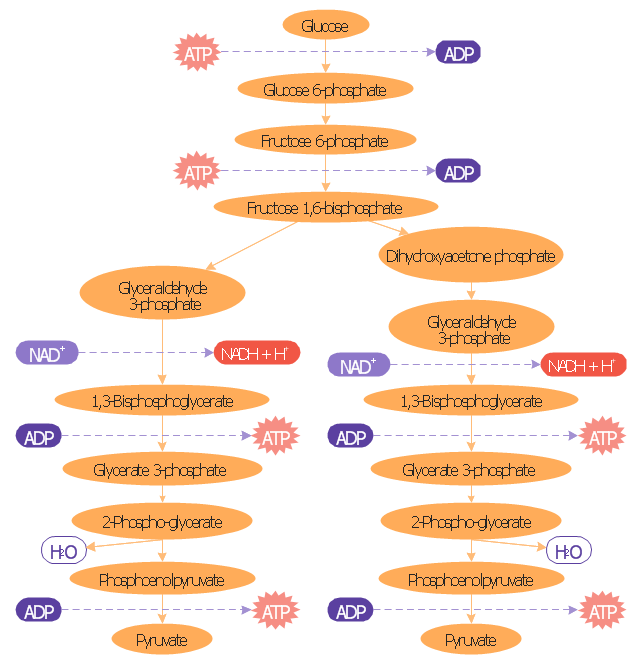
"Glycolysis is the metabolic pathway that converts glucose into pyruvate. The free energy released in this process is used to form the high-energy compounds ATP (adenosine triphosphate) and NADH (reduced nicotinamide adenine dinucleotide)." [Glycolysis. Wikipedia]
This biochemical diagram was redesigned from Wikimedia file: Glycolysis overview.svg. [commons.wikimedia.org/ wiki/ File:Glycolysis_ overview.svg]
The glucose metabolism diagram example "Glycolysis overview" was created using the ConceptDraw PRO diagramming and vector drawing software extended with the Biology solution from the Science and Education area of ConceptDraw Solution Park.
Glycolysis pathway map
Scientific Symbols Chart

Mathematics Solution from the Science and Education area of ConceptDraw Solution Park includes a few shape libraries of plane, solid geometric figures, trigonometrical functions and greek letters to help you create different professional looking mathematic illustrations for science and education.
- Biology | Bio Flowchart Lite | Business Diagram Software |
- Biochemical metabolic pathway map diagram | Glycolysis overview ...
- Biology | Bio Flowchart Lite | Glucose catabolism pathways map |
- Business Diagram Software | Types of Flowchart - Overview | Bio ...
- Glycolysis overview diagram | Catabolism schematic | Glucose ...
- Bar Diagrams for Problem Solving. Create space science bar charts ...
- Bio Flowchart Lite | Metabolic pathway map - Biochemical diagram ...
- Design elements - Biochemistry of metabolism | Biochemical ...
- Biology | Biochemical metabolic pathway map diagram ...
- Biology | Bio Flowchart Lite | ConceptDraw Solution Park |
- Business Diagram Software | Physics | Simple & Fast Diagram ...
- Flowchart Software | Cross-Functional Flowchart (Swim Lanes ...
- eLearning for Skype | Business Diagram Software | Skype as ...
- Metabolic pathway map - Biochemical diagram | Metabolic pathway ...
- Mathematics | Biology | Science and Education Area |
- Physics | Biology | Language Learning |
- Bio Flowchart Lite | Business Diagram Software | Scientific Symbols ...
- Mathematics | Biology | Chemistry |
- Mathematics | Astronomy | Science and Education Area |
- Biology | Metabolic pathway map - Biochemical diagram | Glycolysis ...