 Cross-Functional Flowcharts
The Cross-Functional Flowcharts solution extends ConceptDraw DIAGRAM software with cross functional flowchart examples, samples, and libraries of cross functional flow chart vector design elements and CH-1 symbols for easy drawing professional-looking and illustrative Cross Functional Flowchart, Cross Functional Diagram, CH-1 Diagram, Process Flowchart, Deployment Flowchart, Opportunity Flowchart, Swimlane Process Mapping Diagram, or Visio Cross Functional Flowchart for planning and further analyzing, optimizing and improvement processes. The use of included pre-made cross functional flowchart template, opportunity flowchart template, and swimlane process map template, greatly easier designing your Cross-functional flowcharts.
Basic of Flowchart: Meaning and Symbols


Flow chart ExampleWarehouse Flowchart


Flowchart Software

Value stream with ConceptDraw DIAGRAM

Electrical Symbols — Rotating Equipment

Flowchart Examples and Templates

 Sales Flowcharts
The Sales Flowcharts solution lets you create and display sales process maps, sales process workflows, sales steps, the sales process, and anything else involving sales process management.
Sample for UML

 Plumbing and Piping Plans
Plumbing and Piping Plans solution extends ConceptDraw DIAGRAM software with samples, templates and libraries of pipes, plumbing, and valves design elements for developing of water and plumbing systems, and for drawing Plumbing plan, Piping plan, PVC Pipe plan, PVC Pipe furniture plan, Plumbing layout plan, Plumbing floor plan, Half pipe plans, Pipe bender plans.
Seven Basic Tools of Quality — Quality Control

Design Pictorial Infographics. Design Infographics

Target Diagram

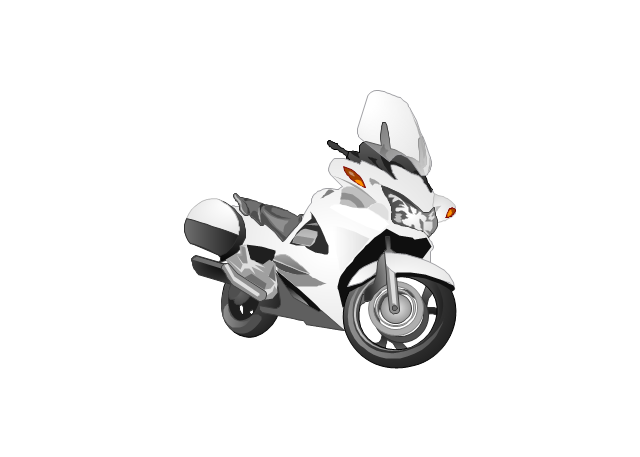
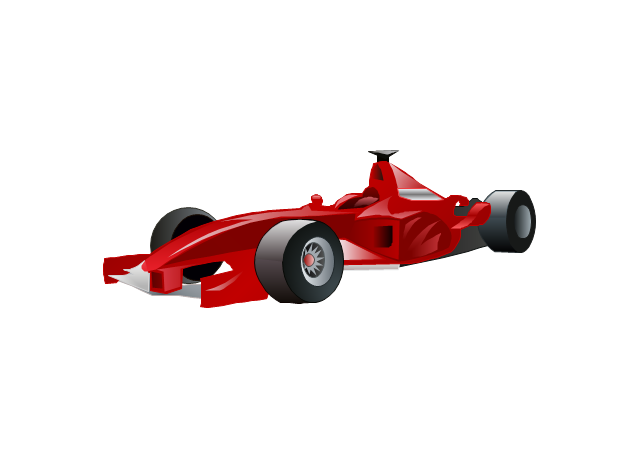
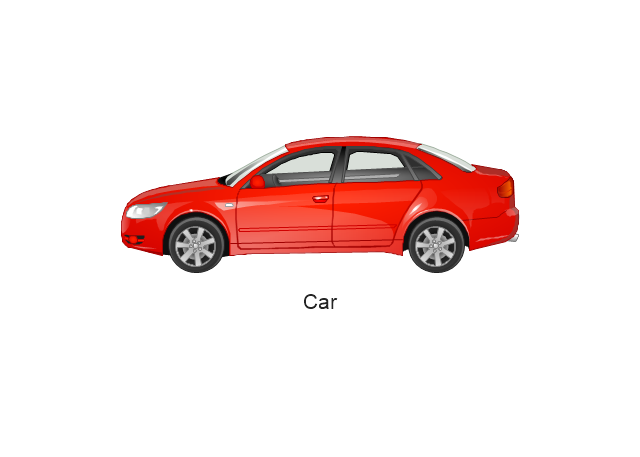
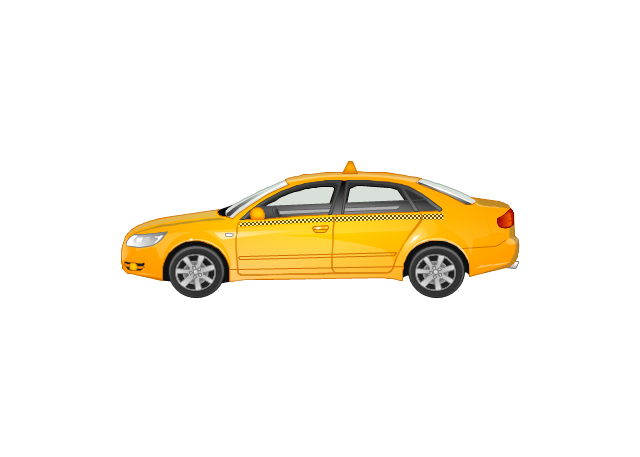
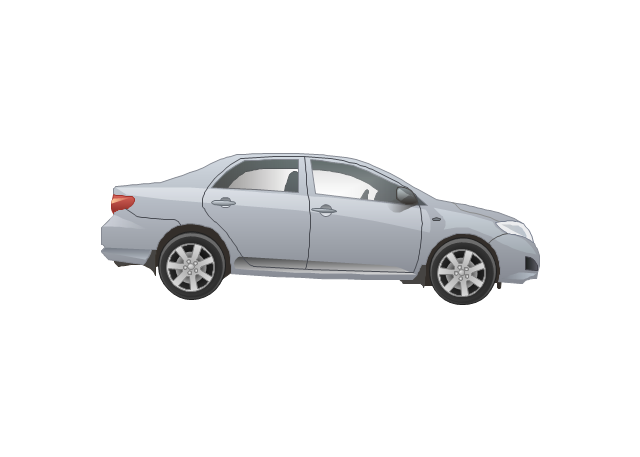
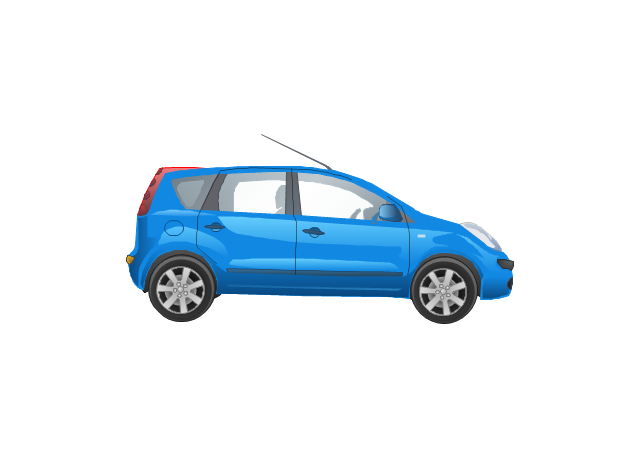
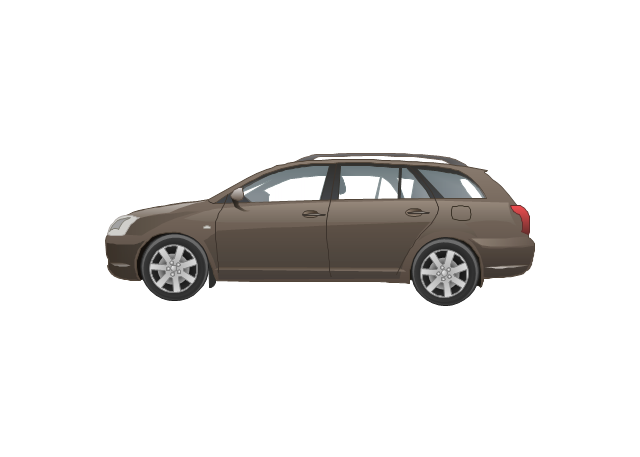
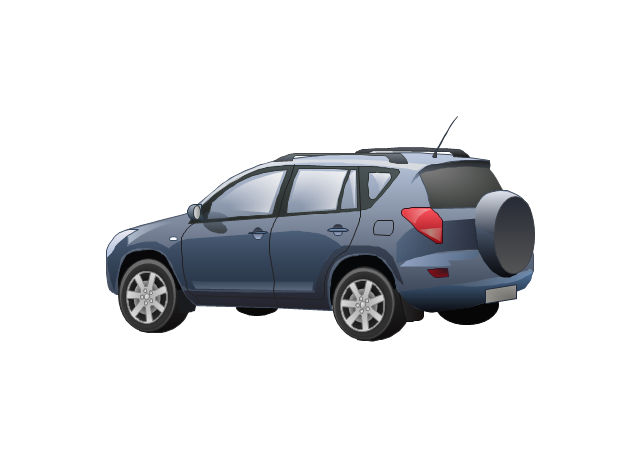
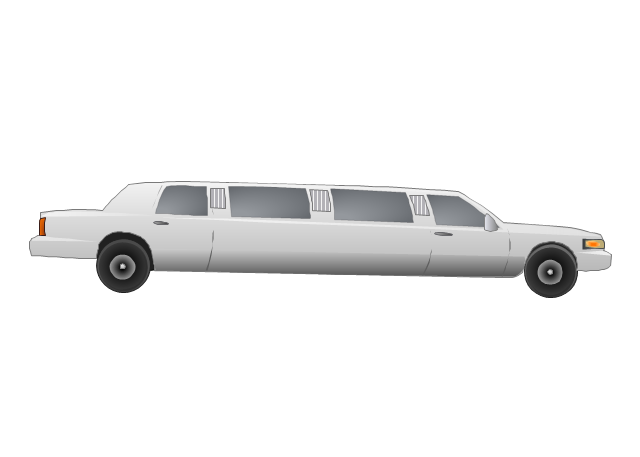
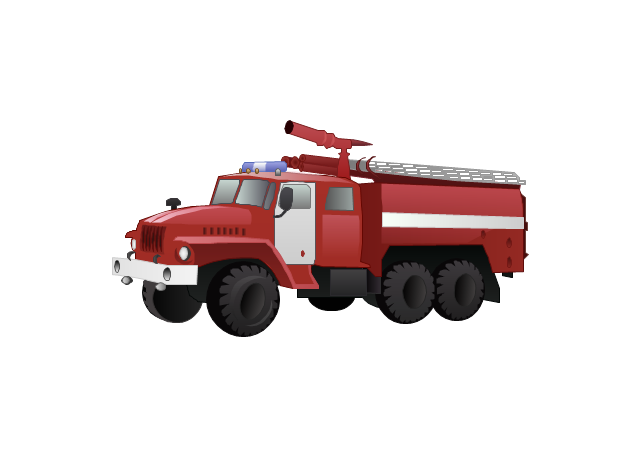
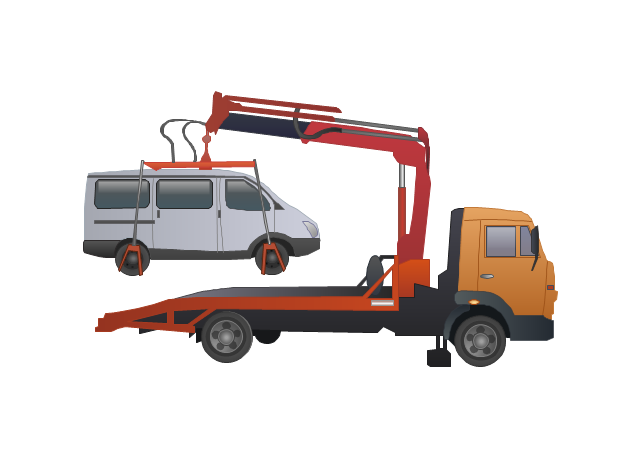
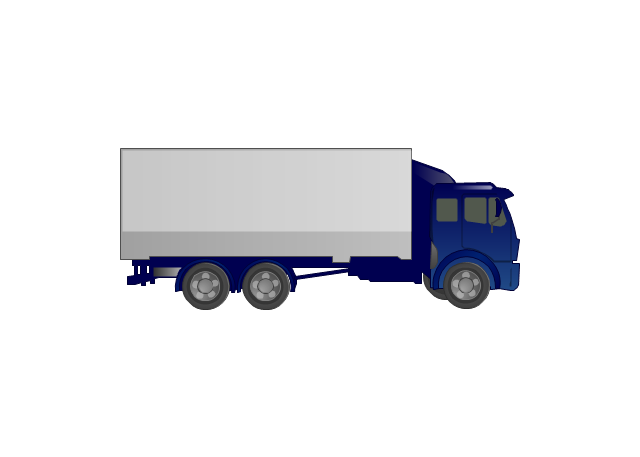
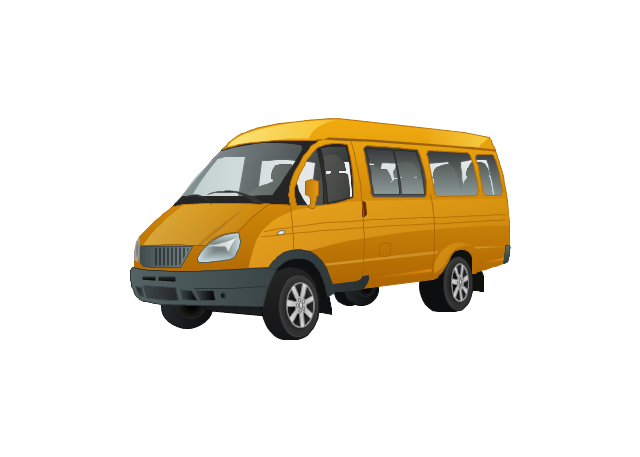
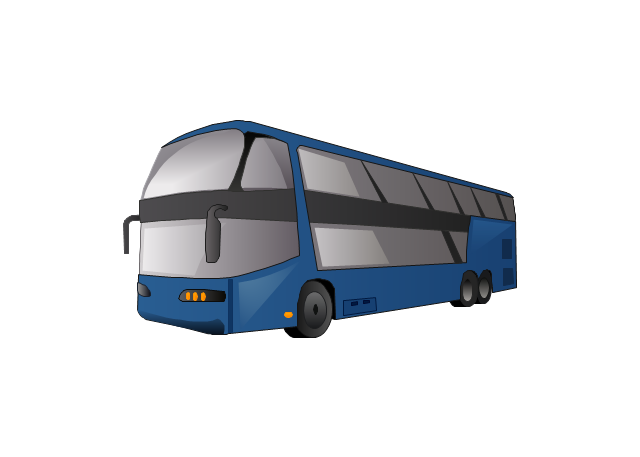
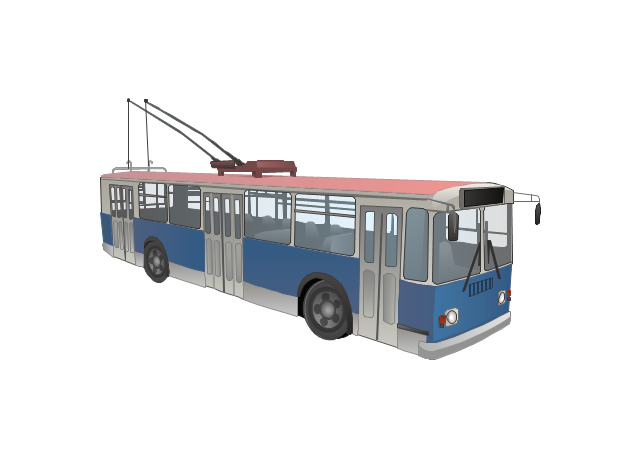
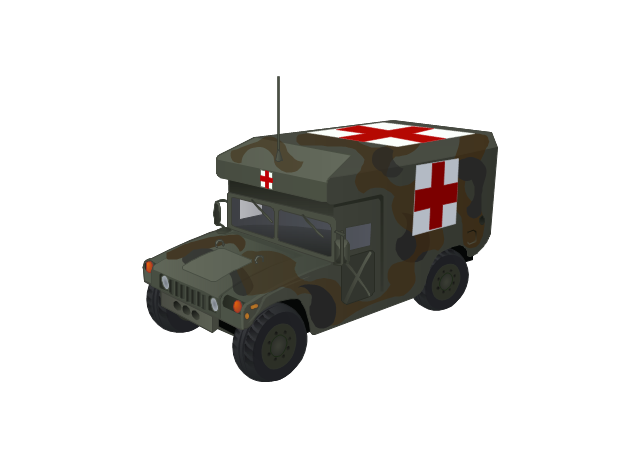
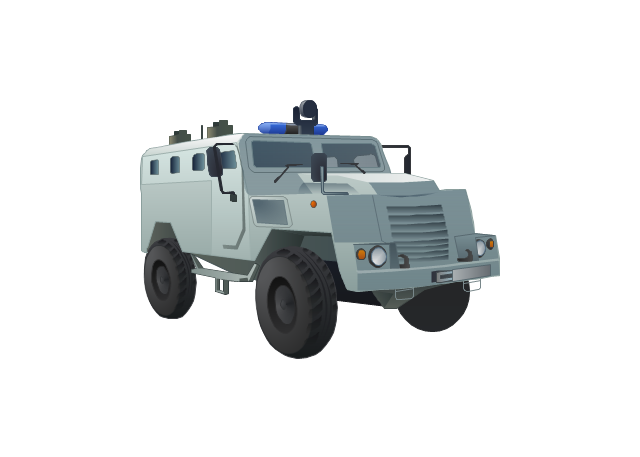
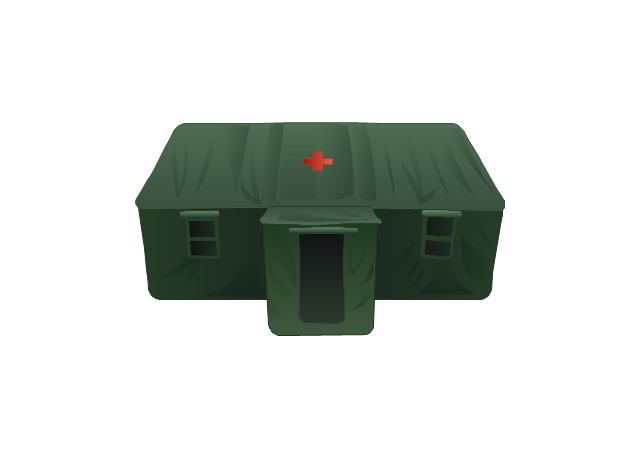
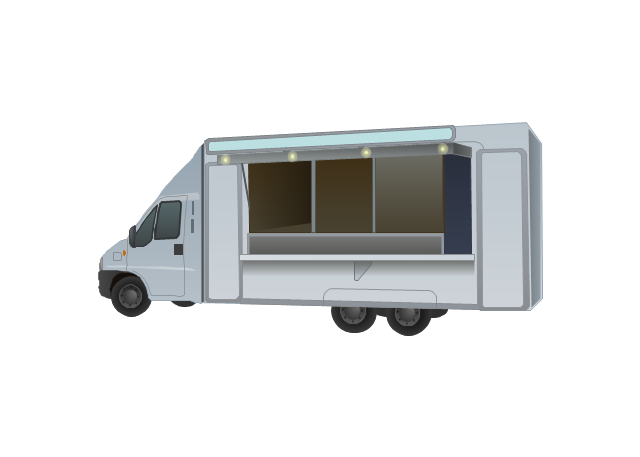
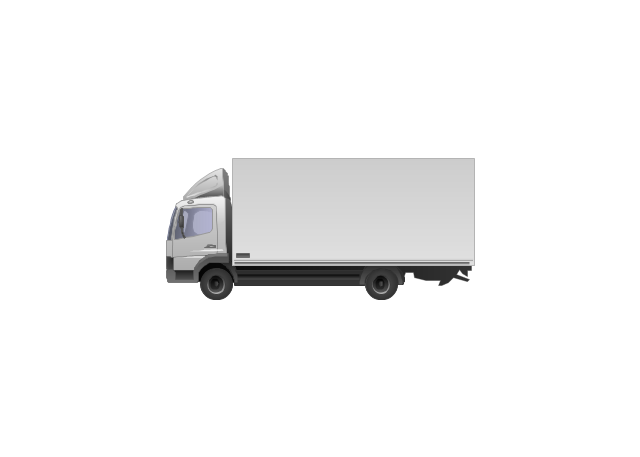
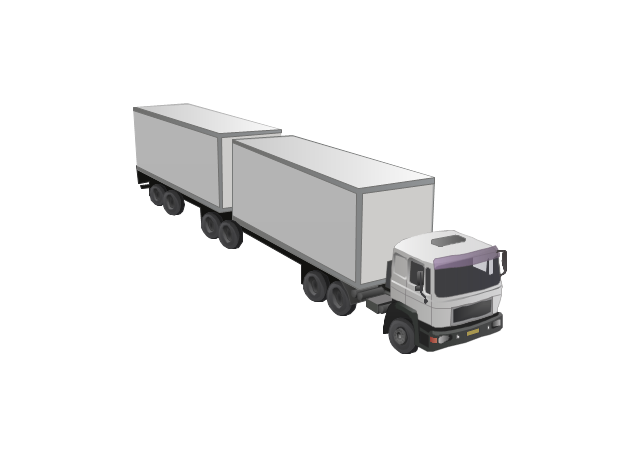
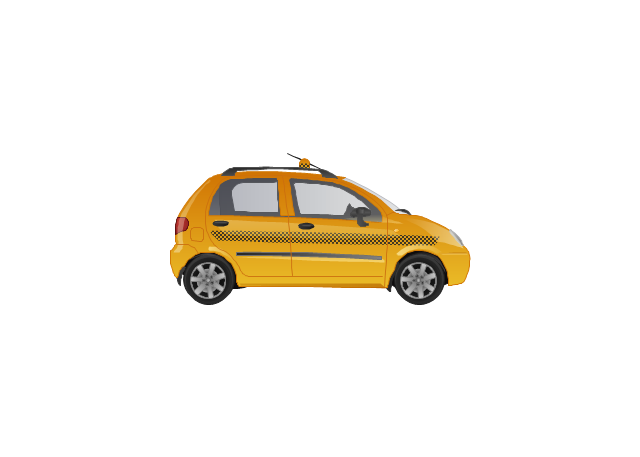
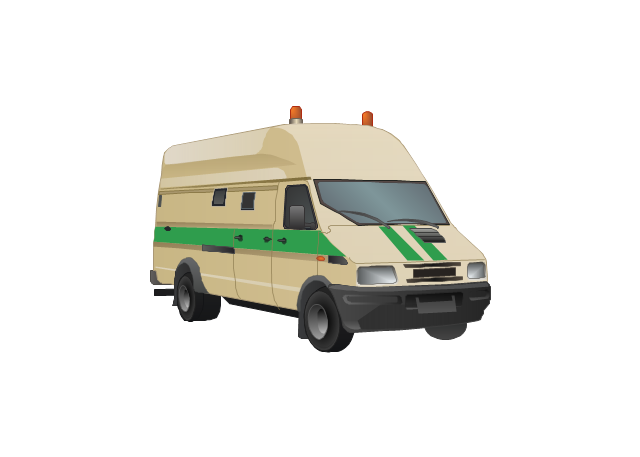
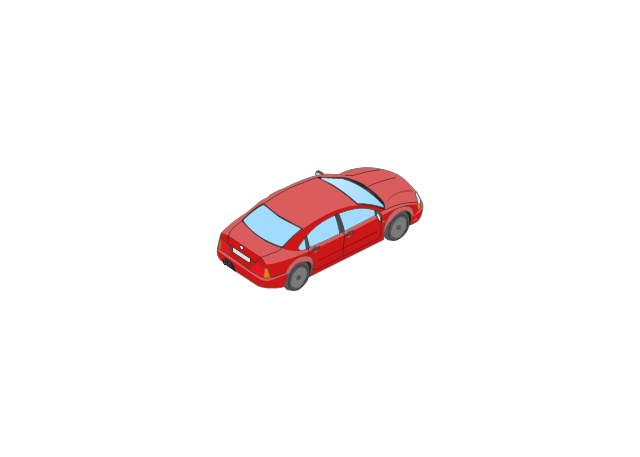
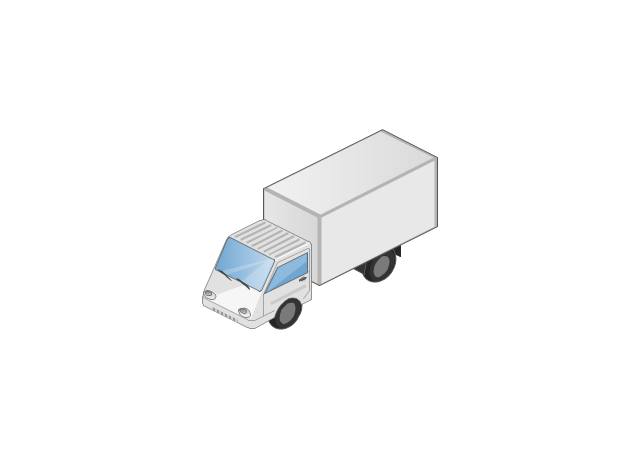
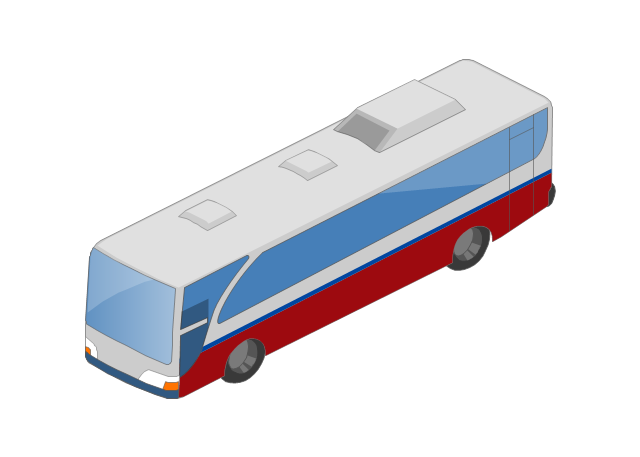
The vector stencils library "Road transport" contains 43 clip art images for creating vehicles and transportation illustrations, presentation slides, infographics and webpages using the ConceptDraw PRO diagramming and vector drawing software.
"Road transport (British English) or road transportation (American English) is the transport of passengers or goods on roads. ...
Transportation.
Transport on roads can be roughly grouped into the transportation of goods and transportation of people. In many countries licencing requirements and safety regulations ensure a separation of the two industries.
The nature of road transportation of goods depends, apart from the degree of development of the local infrastructure, on the distance the goods are transported by road, the weight and volume of the individual shipment, and the type of goods transported. For short distances and light, small shipments a van or pickup truck may be used. For large shipments even if less than a full truckload a truck is more appropriate. In some countries cargo is transported by road in horse-drawn carriages, donkey carts or other non-motorized mode. Delivery services are sometimes considered a separate category from cargo transport. In many places fast food is transported on roads by various types of vehicles. For inner city delivery of small packages and documents bike couriers are quite common.
People are transported on roads either in individual cars or automobiles, or in mass transit by bus or coach. Special modes of individual transport by road like rickshaws or velotaxis may also be locally available." [Road transport. Wikipedia]
The vector stencils library "Road transport" is included in the Aerospace and Transport solution from the Illustrations area of ConceptDraw Solution Park.
www.conceptdraw.com/ solution-park/ illustrations-aerospace-transport
Bicycle

Motorcycle
Race car
Car
Taxi
Sedan
Hatchback
Estate car
4x4
Limousine
Police car

Ambulance

Fire apparatus
Wrecker
Semi truck

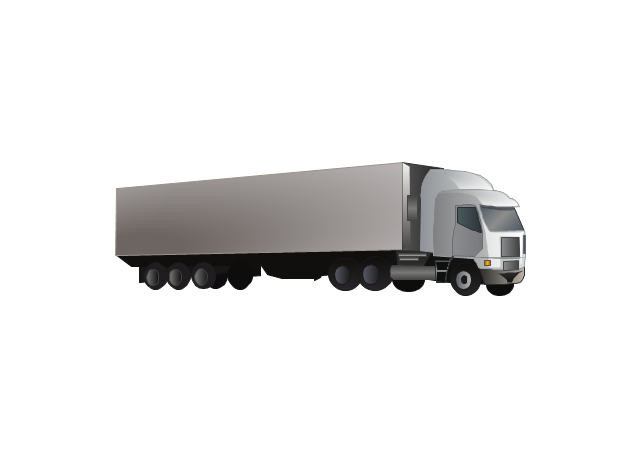
Truck
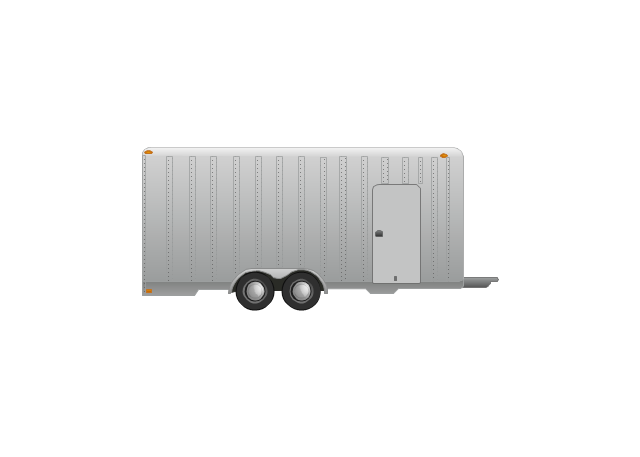
Trailer
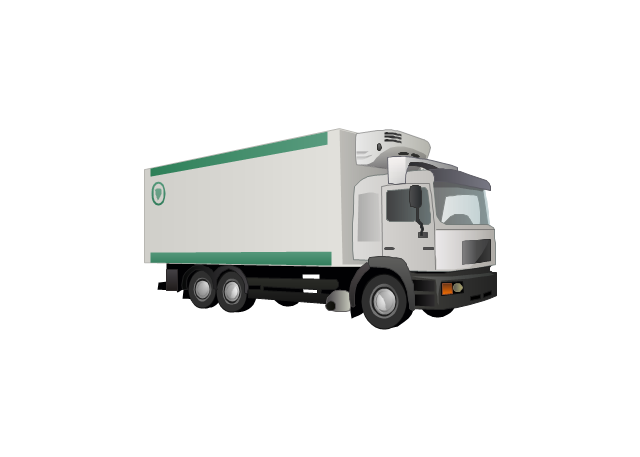
Refrigeration Truck
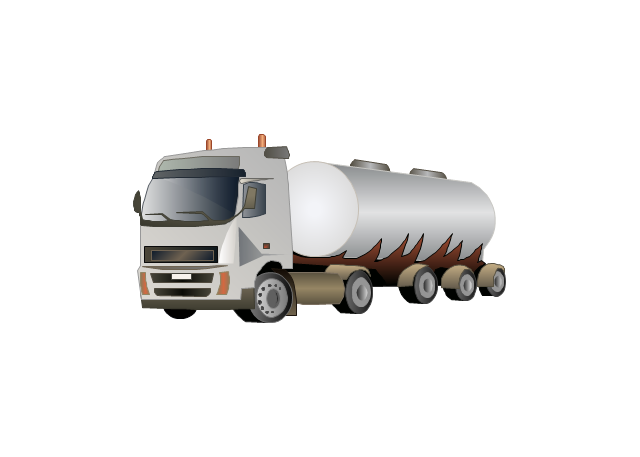
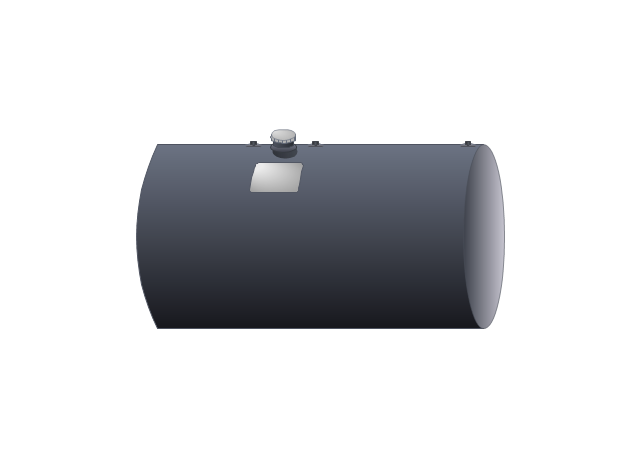
Petrol Tanker
Truck
Minibus
City Bus
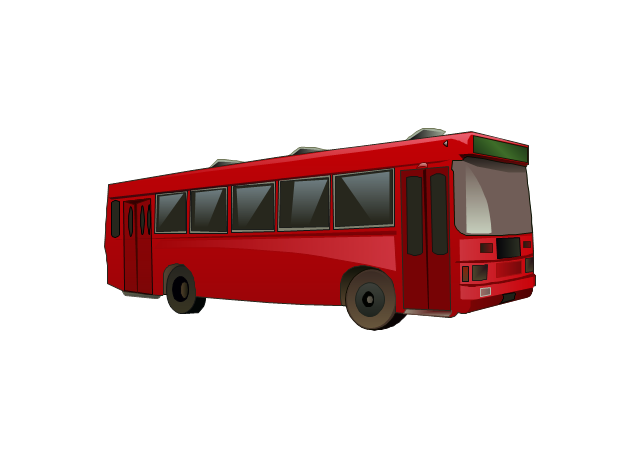
Bus

Sightseeing Bus

Double-decker Bus
Trolleybus
Military Ambulance
Armored police vehicle
First Aid Tent
Catering Vehicle
Semi-trailer
Fuel Tank
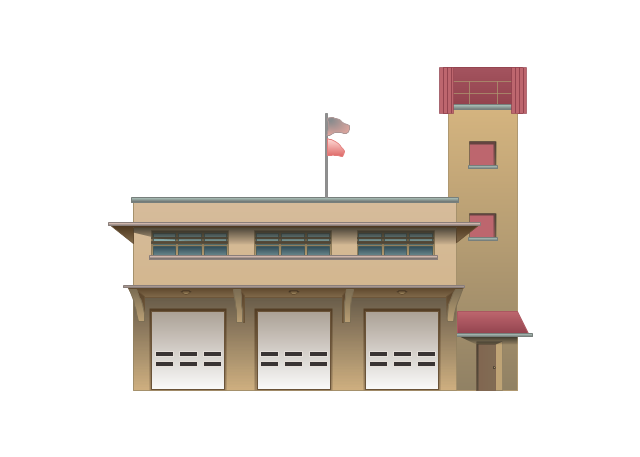
Fire Station
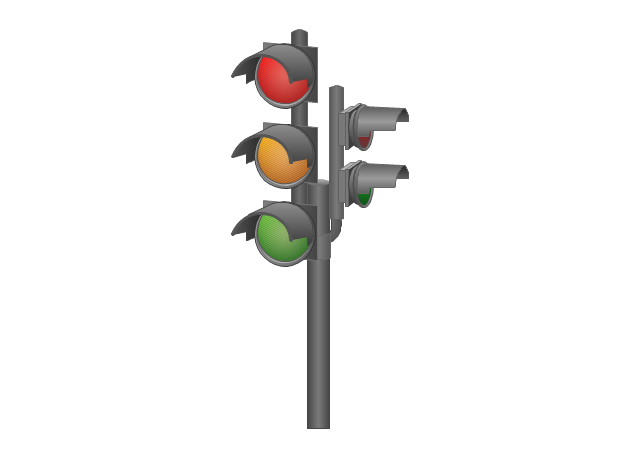
Signal Light
Walkie-Talkie

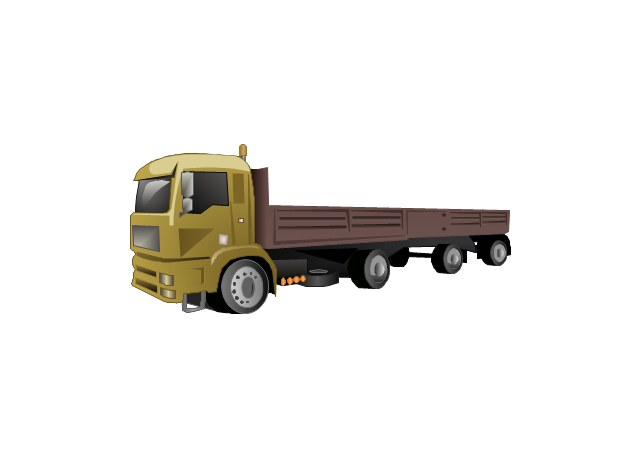
Lorry
B-Train
Taxi
Armored cash transport car
Car isometric
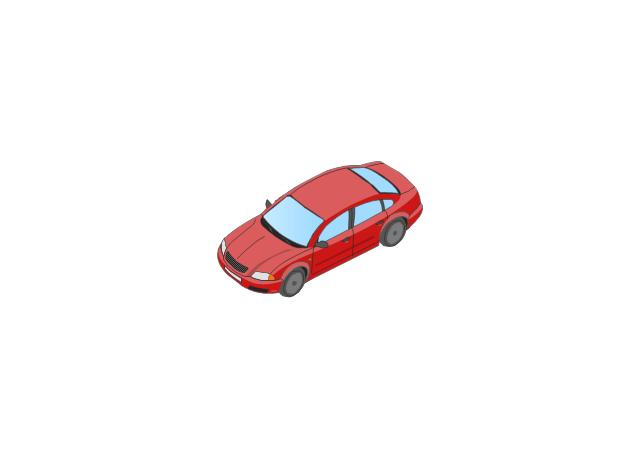
Car isometric
Box truck isometric
Bus isometric
 Seven Management and Planning Tools
Seven Management and Planning Tools solution extends ConceptDraw DIAGRAM and ConceptDraw MINDMAP with features, templates, samples and libraries of vector stencils for drawing management mind maps and diagrams.
 Entity-Relationship Diagram (ERD)
Entity-Relationship Diagram (ERD) solution extends ConceptDraw DIAGRAM charting and vector drawing software with the ability to describe a database using the Entity-Relationship model. This solution includes icons advocated by Chen’s and Crow’s Foot notation that can be used when describing a database. The vector graphic diagrams produced when using this solution can be employed in your white papers, presentations, data sheets, posters, or any technical material.
- Cross-Functional Flowcharts | | Flow Chart For Food Ordering Design
- Ordering Process Flowchart . Flowchart Examples | Flowchart ...
- Cross-Functional Flowcharts | Ordering Food Flowchart
- Flow Chart Symbols | Flow Map | Fast Food Operation Process Chart
- Purchasing Flowchart - Purchase Order . Flowchart Examples ...
- Work Order Process Flowchart . Business Process Mapping ...
- Food Art | Fruit Art | Business and Finance Illustrations | Pict Art ...
- Shipping, receiving and storage | Warehouse layout floor plan ...
- Process Flowchart | Work Order Process Flowchart . Business ...
- Cafe Design | Design Data Flow. DFD Library | Data Flow Diagram ...