Flow Chart in Chemistry

Basic Diagramming Flowchart Software

Basic Diagramming


 Chemical and Process Engineering
Extending the ConceptDraw DIAGRAM diagramming and drawing software with process flow diagram symbols, samples, process diagrams templates and libraries of design elements for creating process and instrumentation diagrams, block flow diagrams, process flow diagrams, and piping and instrumentation diagrams for chemical and process engineering, the Chemical and Process Engineering solution can be used by both chemical and project engineers, as well as the chemists for creating the needed drawings.
Basic Flowchart Examples

Build a Flowchart Quickly With AutoConnect

 Audit Flowcharts
Audit flowcharts solution extends ConceptDraw DIAGRAM software with templates, samples and library of vector stencils for drawing the audit and fiscal flow charts.
Chemical Engineering Flow Chart

 Cross-Functional Flowcharts
The Cross-Functional Flowcharts solution extends ConceptDraw DIAGRAM software with cross functional flowchart examples, samples, and libraries of cross functional flow chart vector design elements and CH-1 symbols for easy drawing professional-looking and illustrative Cross Functional Flowchart, Cross Functional Diagram, CH-1 Diagram, Process Flowchart, Deployment Flowchart, Opportunity Flowchart, Swimlane Process Mapping Diagram, or Visio Cross Functional Flowchart for planning and further analyzing, optimizing and improvement processes. The use of included pre-made cross functional flowchart template, opportunity flowchart template, and swimlane process map template, greatly easier designing your Cross-functional flowcharts.
Flow Chart Template

SDL Flowchart Symbols

Database Flowchart Symbols

Seven Basic Tools of Quality - Flow Chart

Flowchart Software

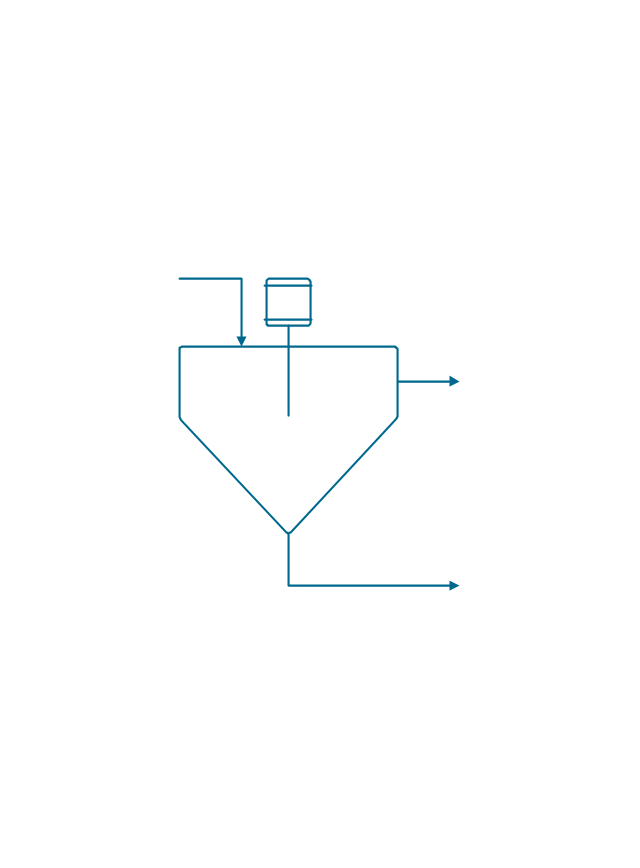
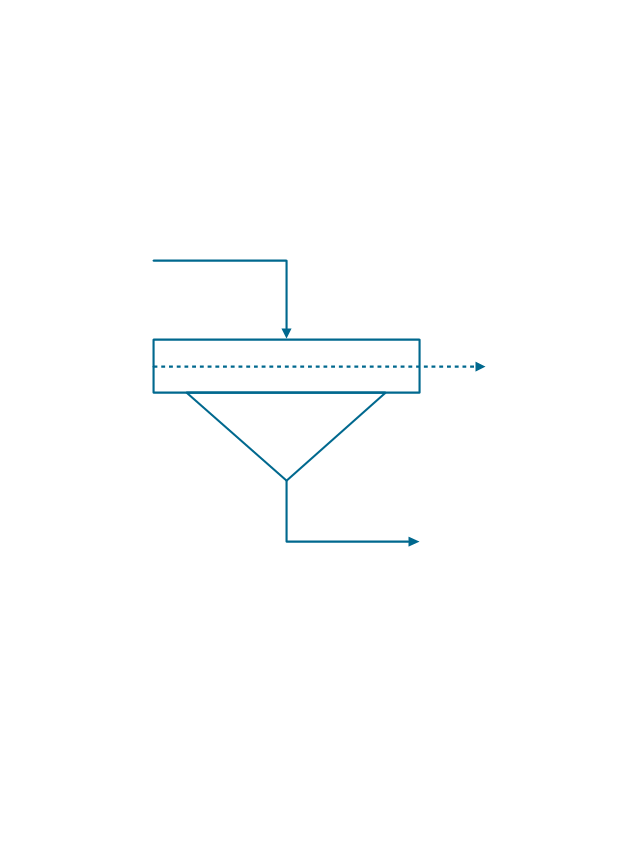
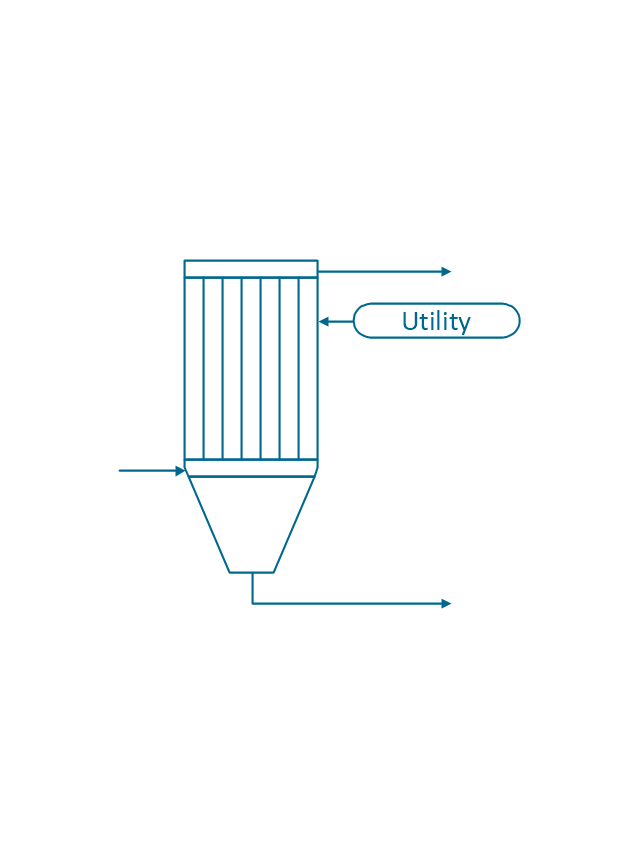
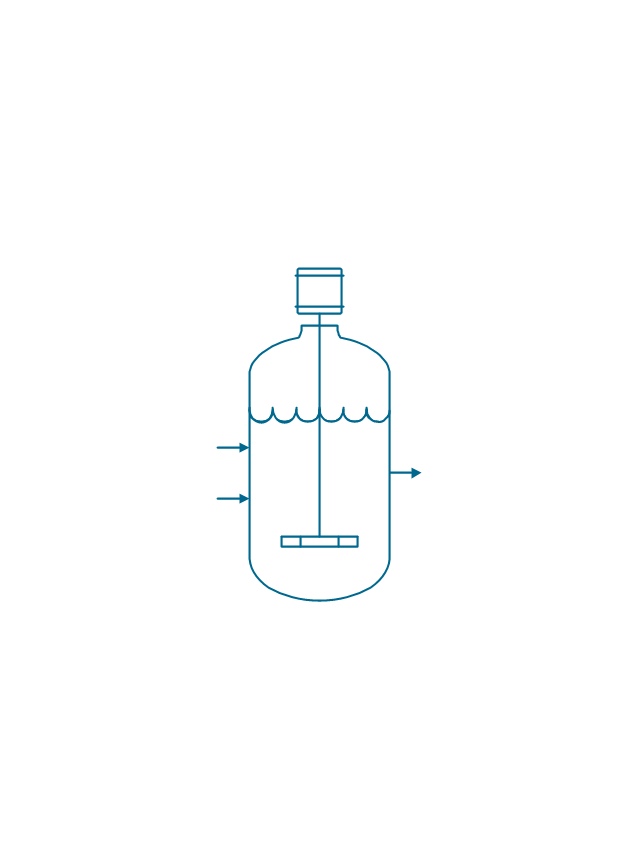
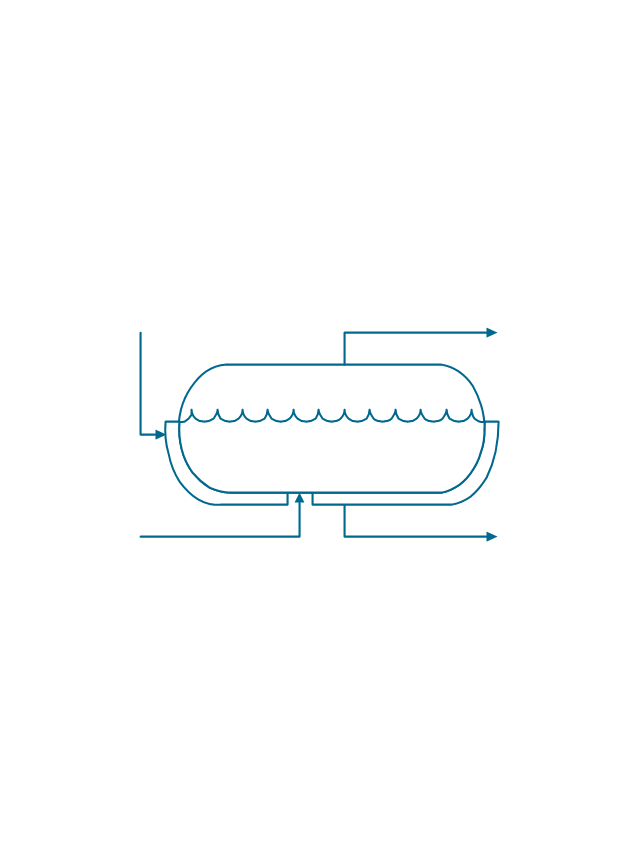
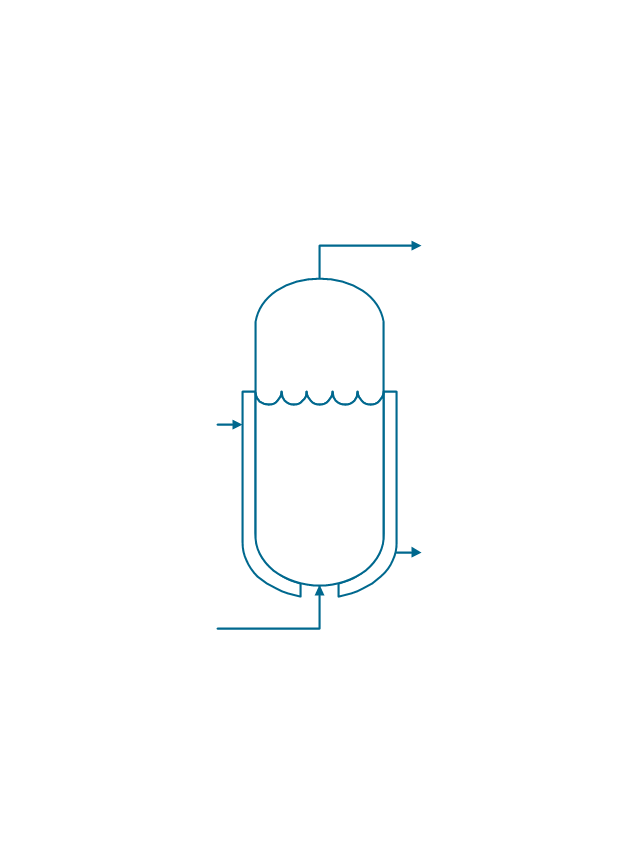
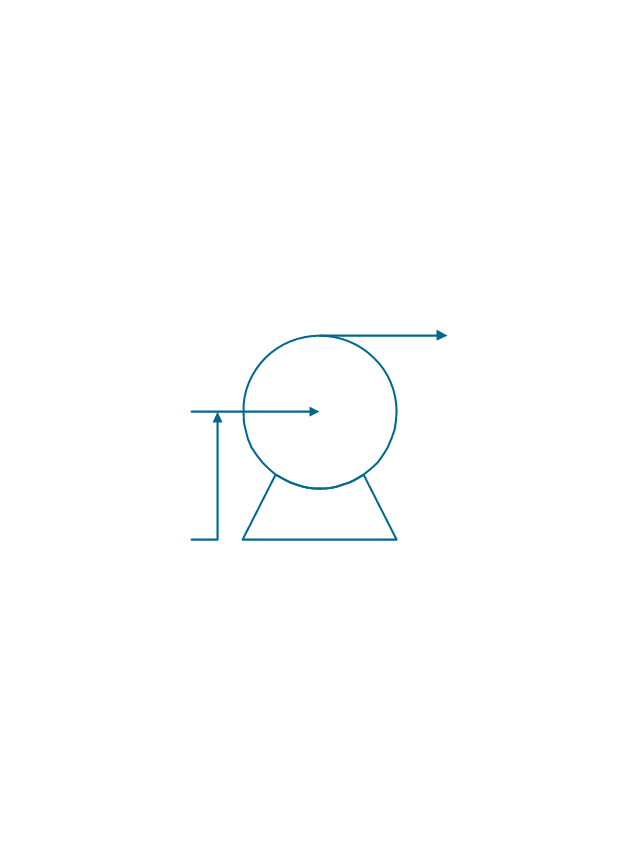
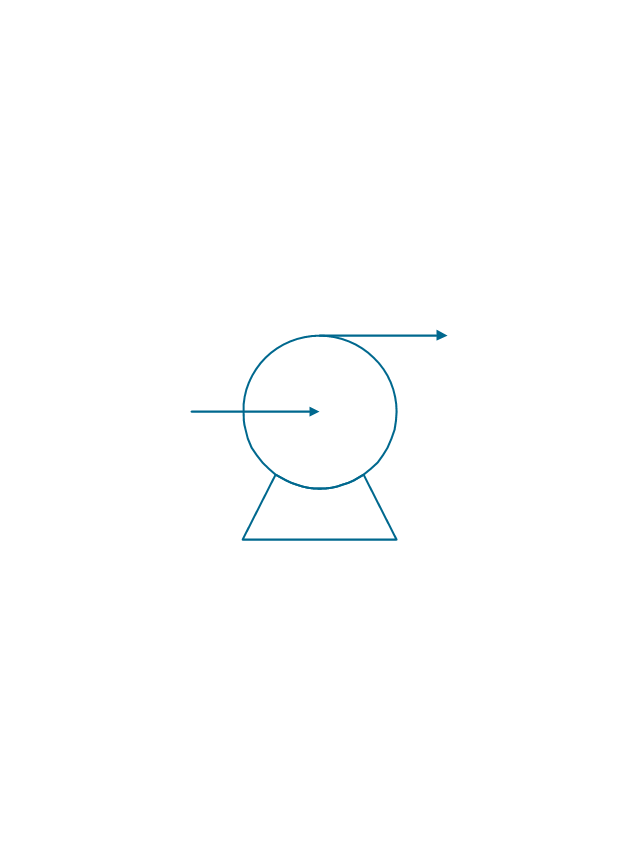
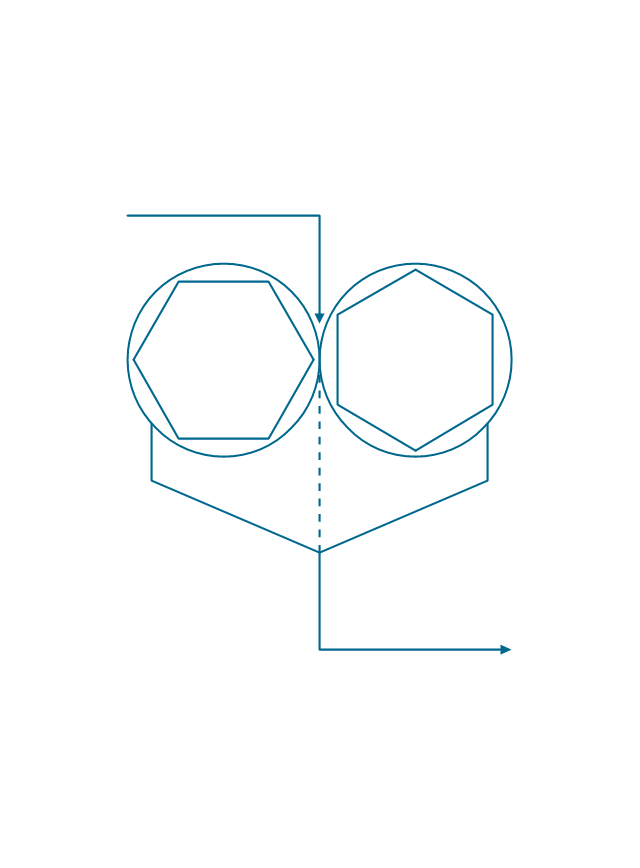
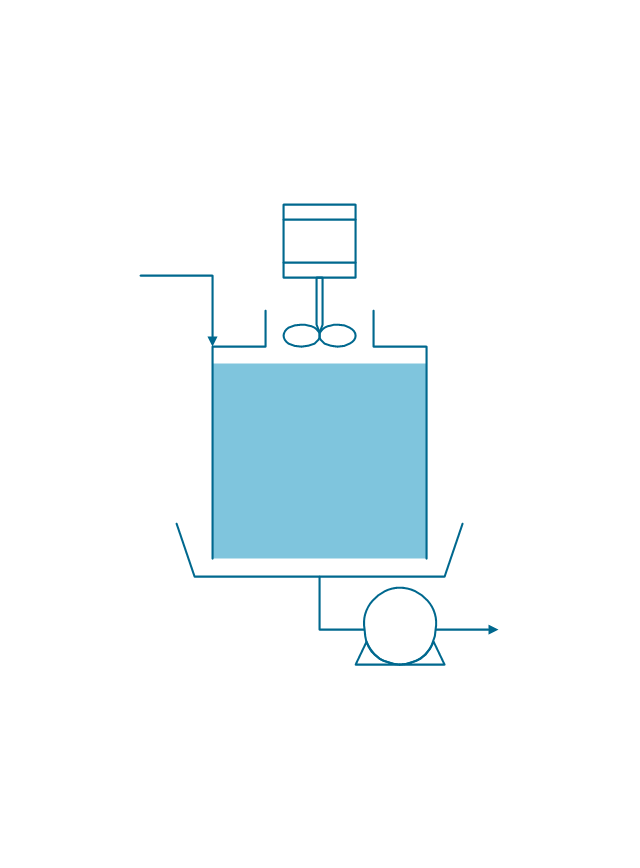
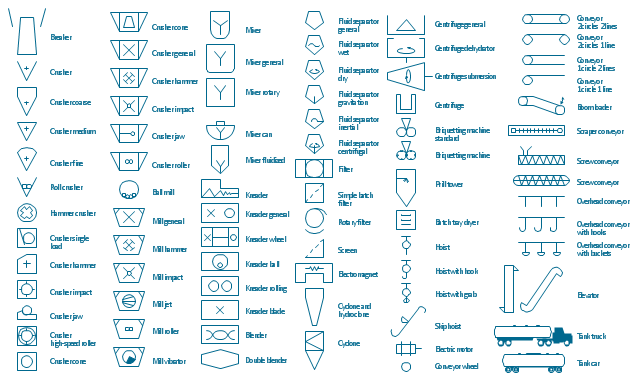
The vector stencils library "Chemical engineering" contains 24 symbols of chemical and process engineering equipment.
Use these shapes for drawing Process Flow Diagrams (PFD), Piping and Instrumentation Diagrams (P&ID), and Water Flow Diagrams in the ConceptDraw PRO software extended with the Chemical and Process Engineering solution from the Chemical and Process Engineering area of ConceptDraw Solution Park.
www.conceptdraw.com/ solution-park/ engineering-chemical-process
Clarifier
Screen
Filter
Agitator
Vapor 1
Vapor 2
Vessel

Pump mixer
Centrifugal pump
Fan
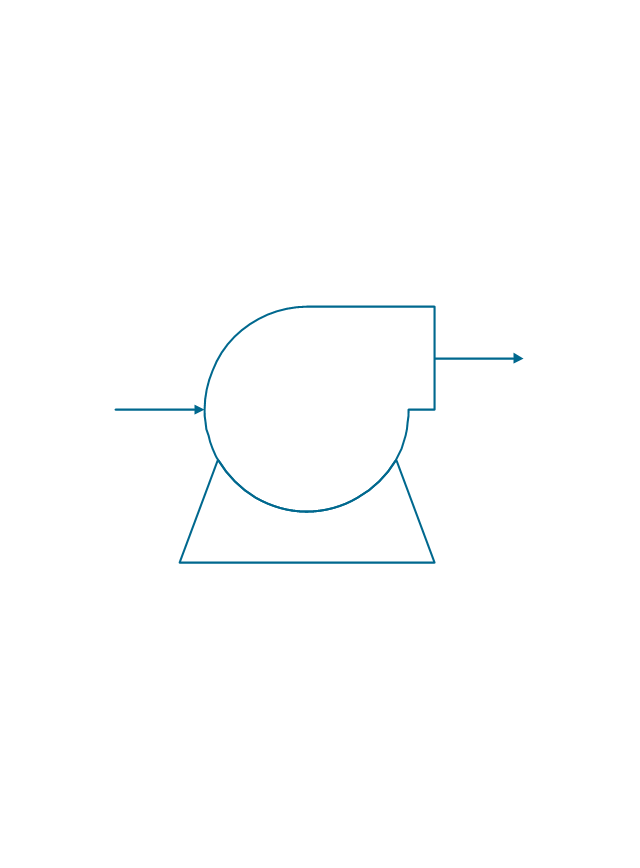
Blower

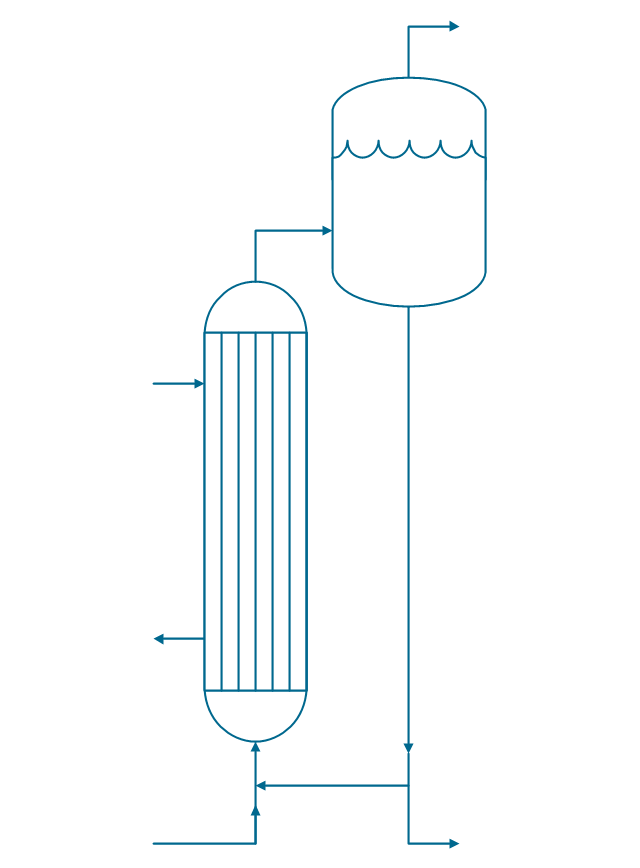
Evaporator
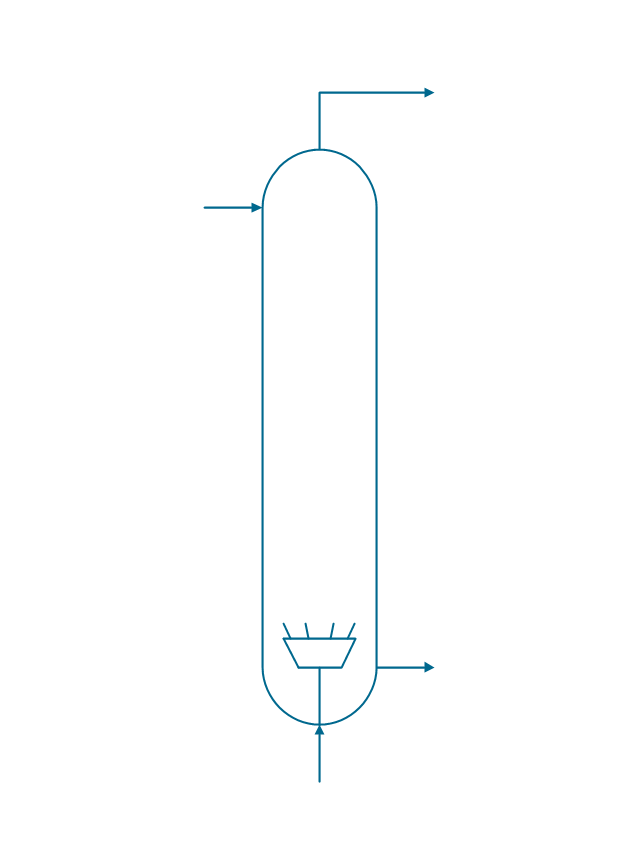
Tower
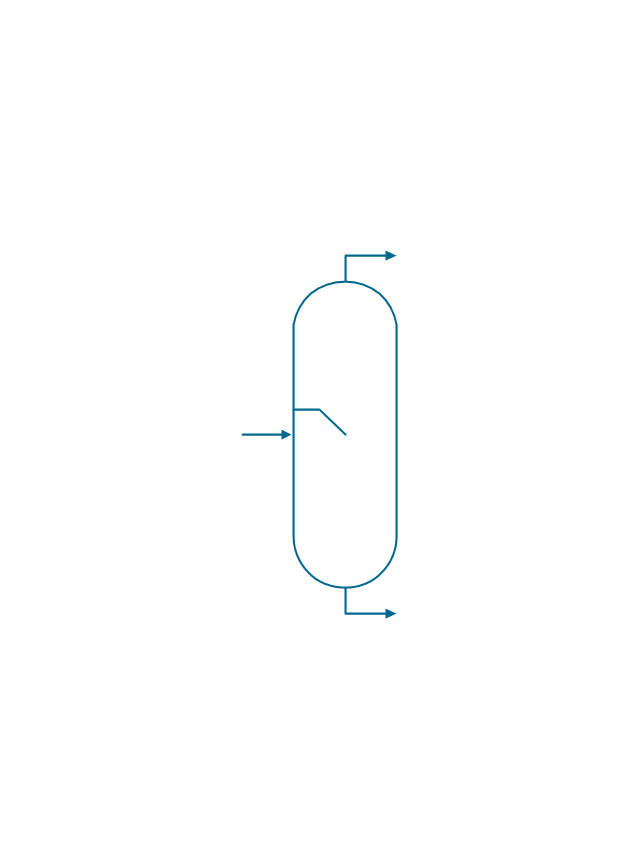
Flash drum
Roll press
Cooling tower
Tank car

Tank truck

Kettle
Valve

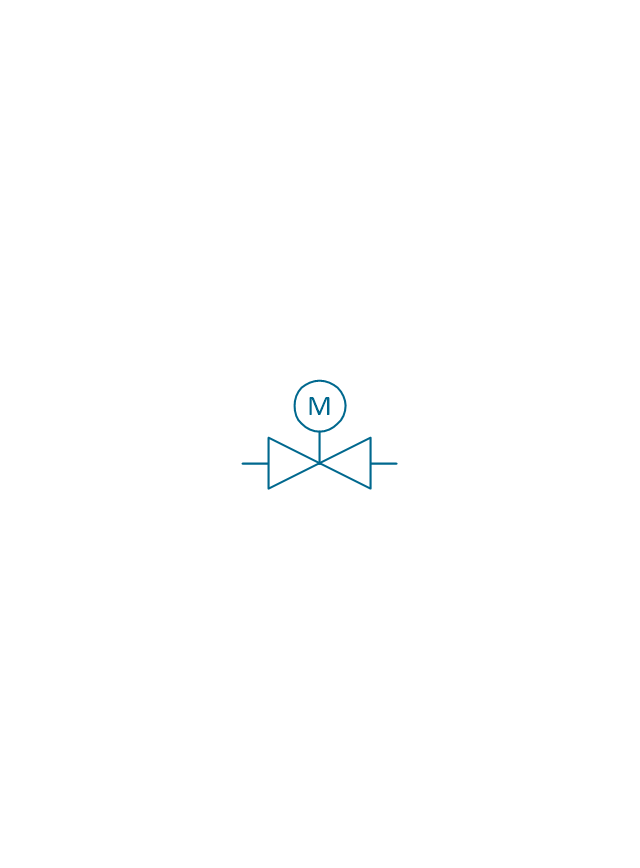
Motor valve
Venturi

Propeller

Instrument

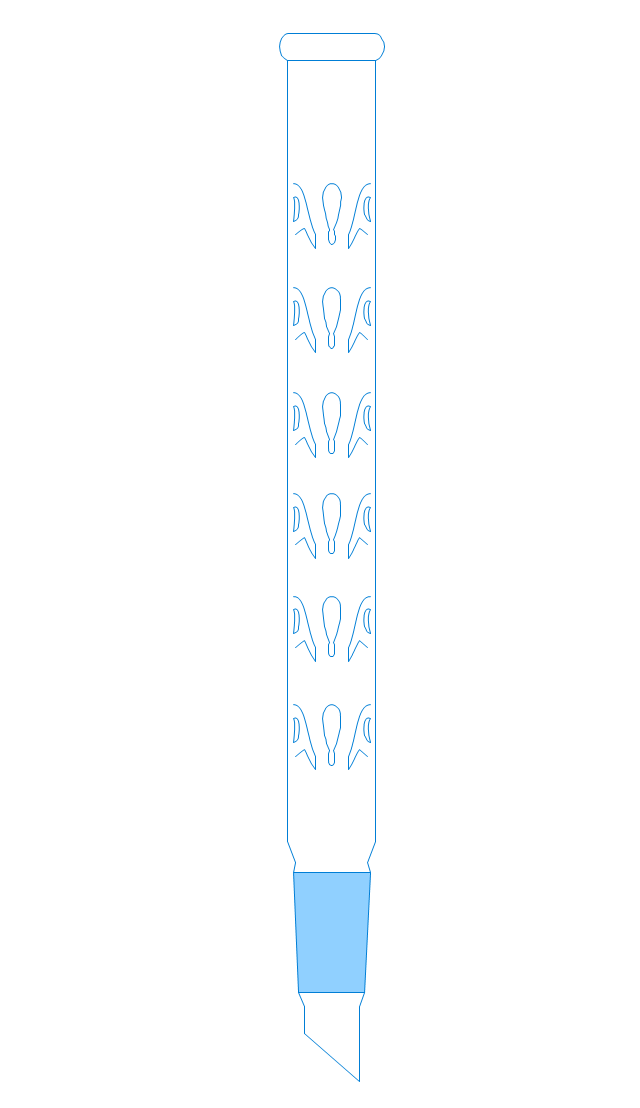
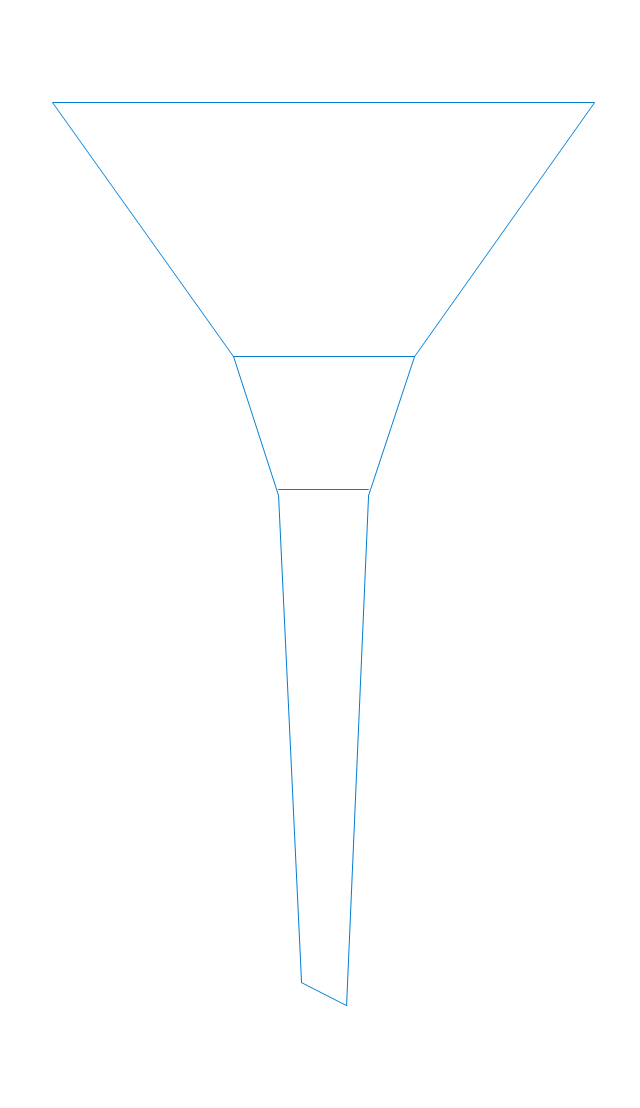
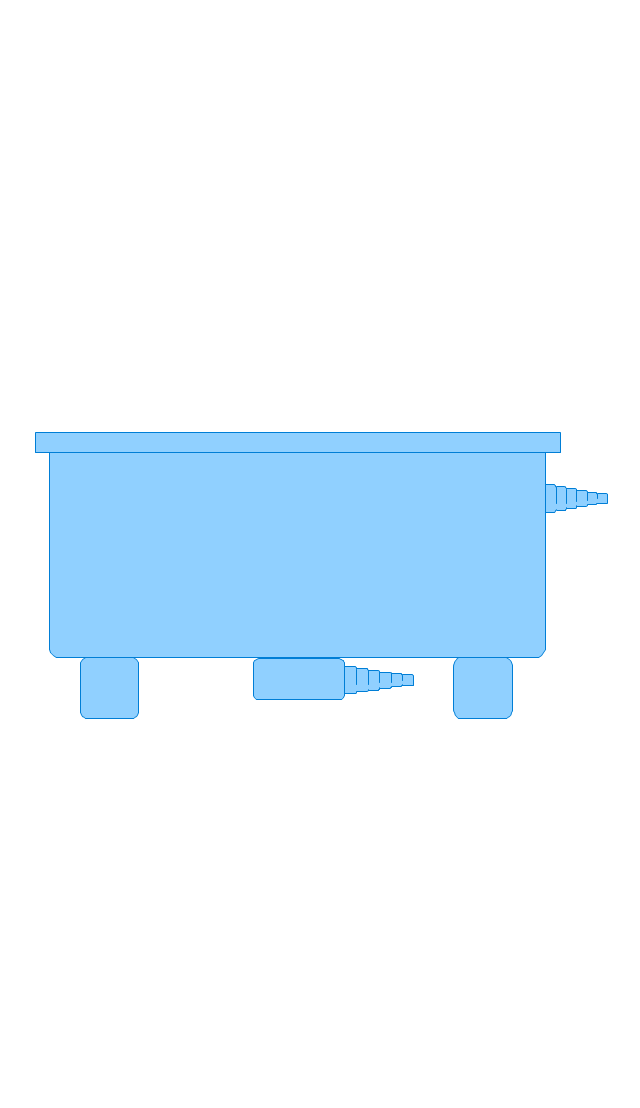
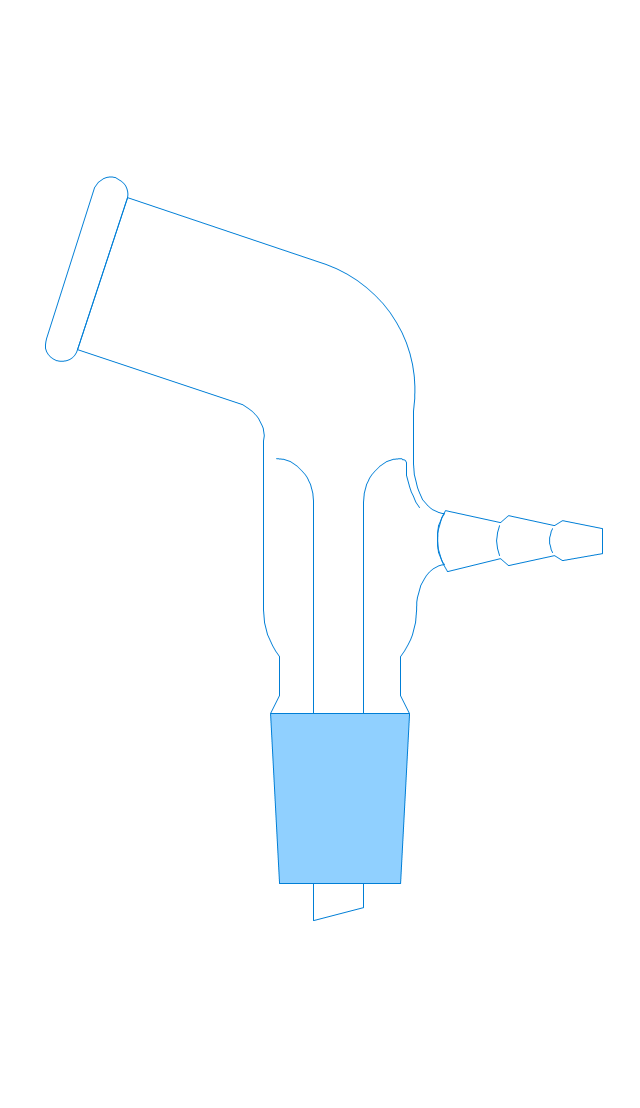
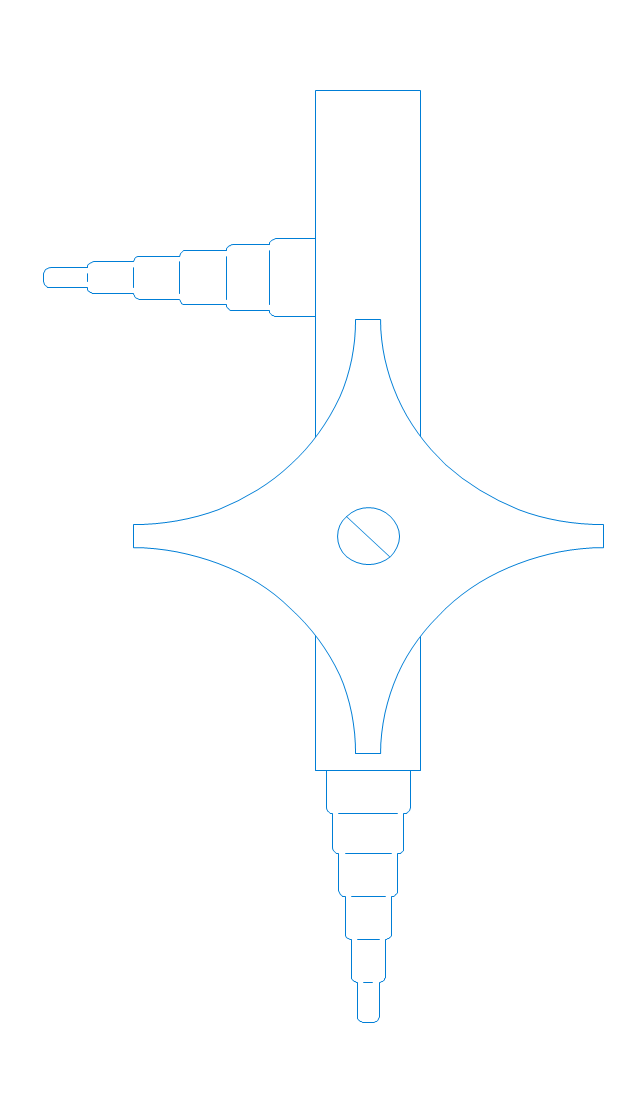
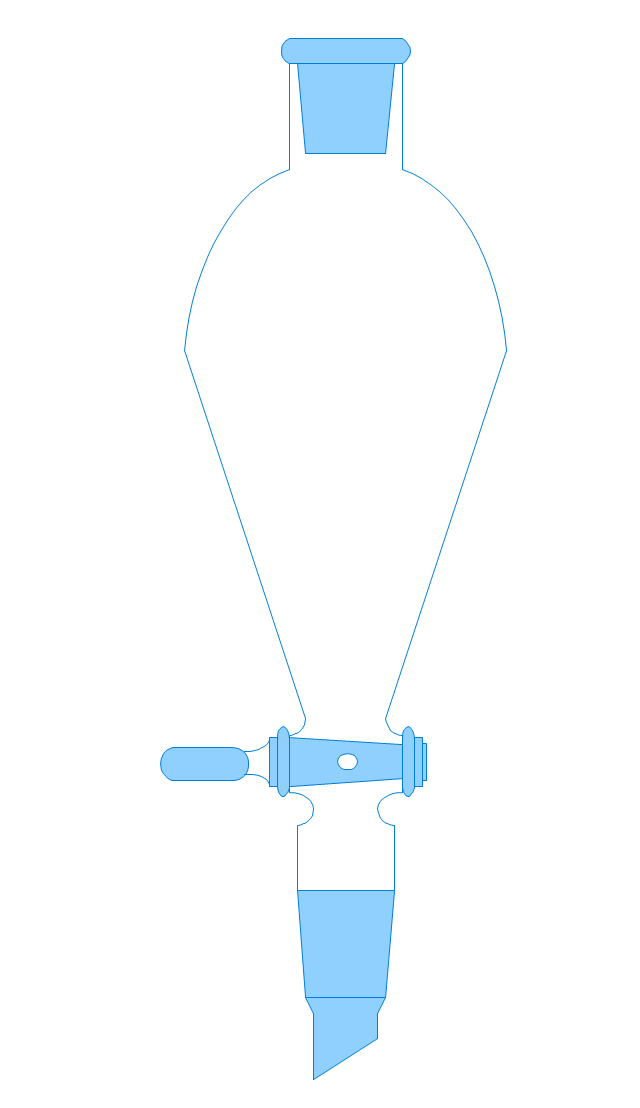
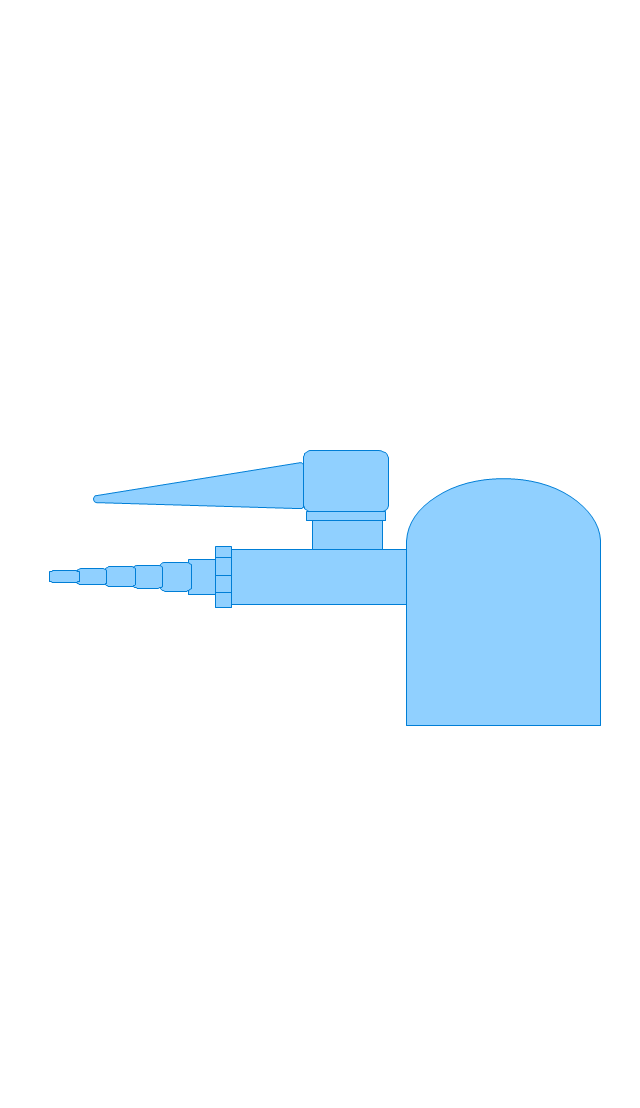
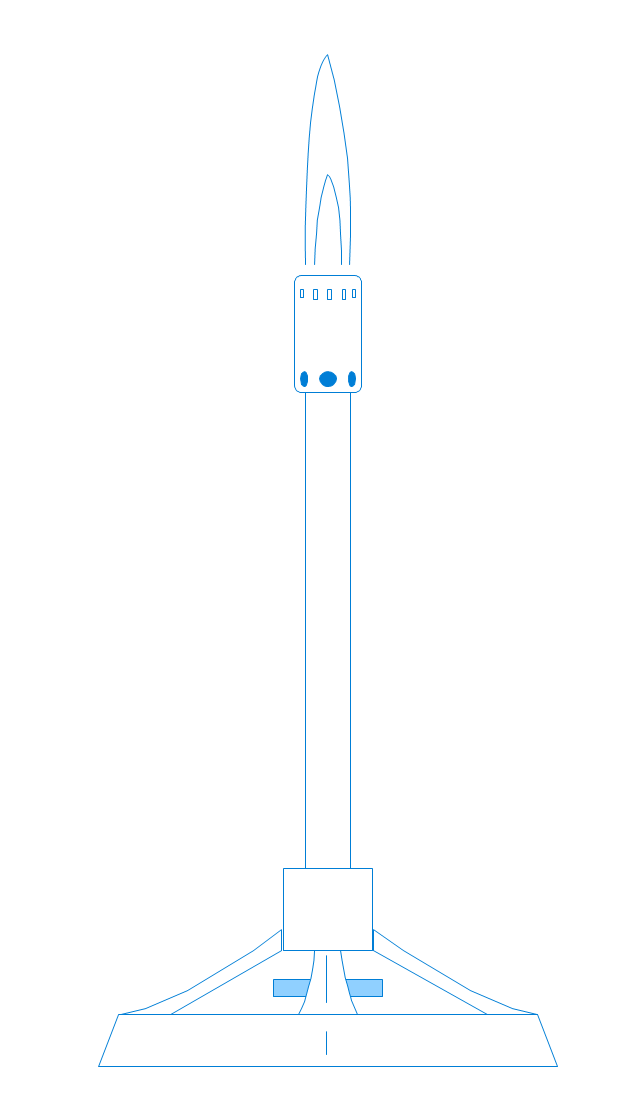
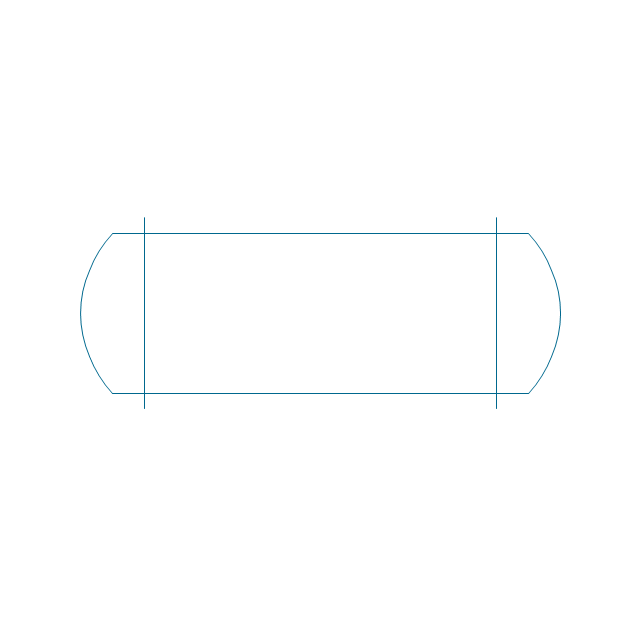
The vector stencils library "Laboratory equipment" contains 31 clipart icons of chemical laboratory equipment and labware.
Use these shapes for drawing part assembly and mounting schemes of glassware apparatus in chemical experiment diagrams and illustrations in the ConceptDraw PRO diagramming and vector drawing software extended with the Chemistry solution from the Science and Education area of ConceptDraw Solution Park.
Use these shapes for drawing part assembly and mounting schemes of glassware apparatus in chemical experiment diagrams and illustrations in the ConceptDraw PRO diagramming and vector drawing software extended with the Chemistry solution from the Science and Education area of ConceptDraw Solution Park.
Vigreux distillation column
Hirsch funnel
Oil bath

Steam bath
Thermometer

Tap (valve)
--laboratory-equipment---vector-stencils-library.png--diagram-flowchart-example.png)
Vacuum adaptor
Liebig condenser (long)
-laboratory-equipment---vector-stencils-library.png--diagram-flowchart-example.png)
Liebig condenser (short)
-laboratory-equipment---vector-stencils-library.png--diagram-flowchart-example.png)
Water faucet
Büchner flask

Stemless funnel

Stemmed funnel

Separatory funnel
Heating mantle

Hot plate

Gas tap
Folded filter paper

Y-Adaptor
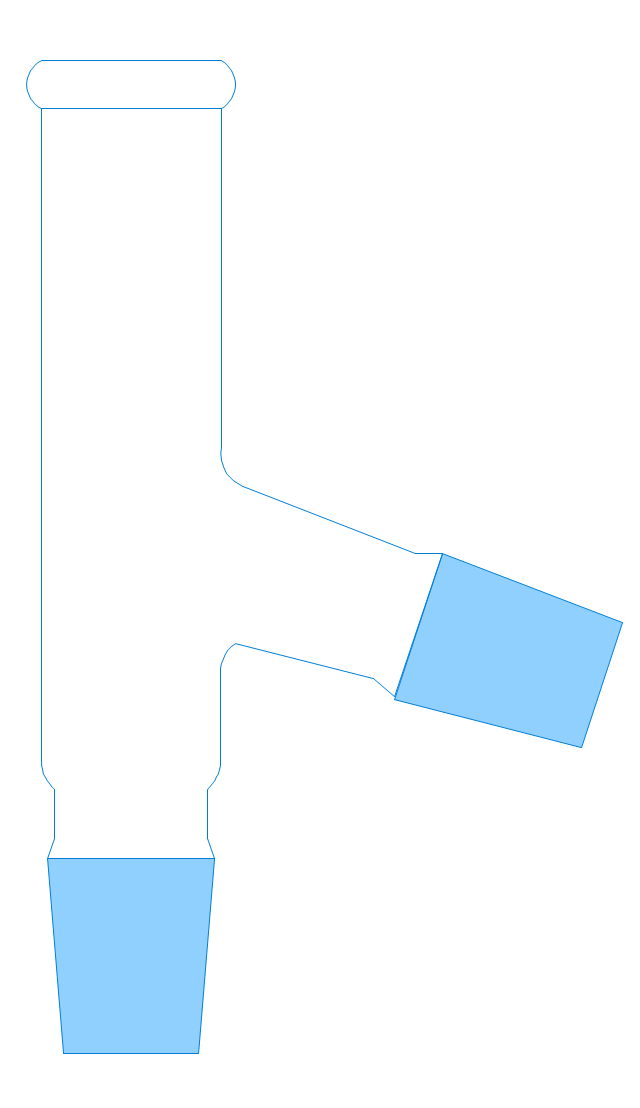
Claisen adapter

Bunsen burner
Büchner funnel

Erlenmeyer flask, 25ml

Round-bottom flask, 50ml

Round-bottom flask, 250ml

Beaker 100ml, filled

Beaker 100ml, empty

Beaker 500ml, filled
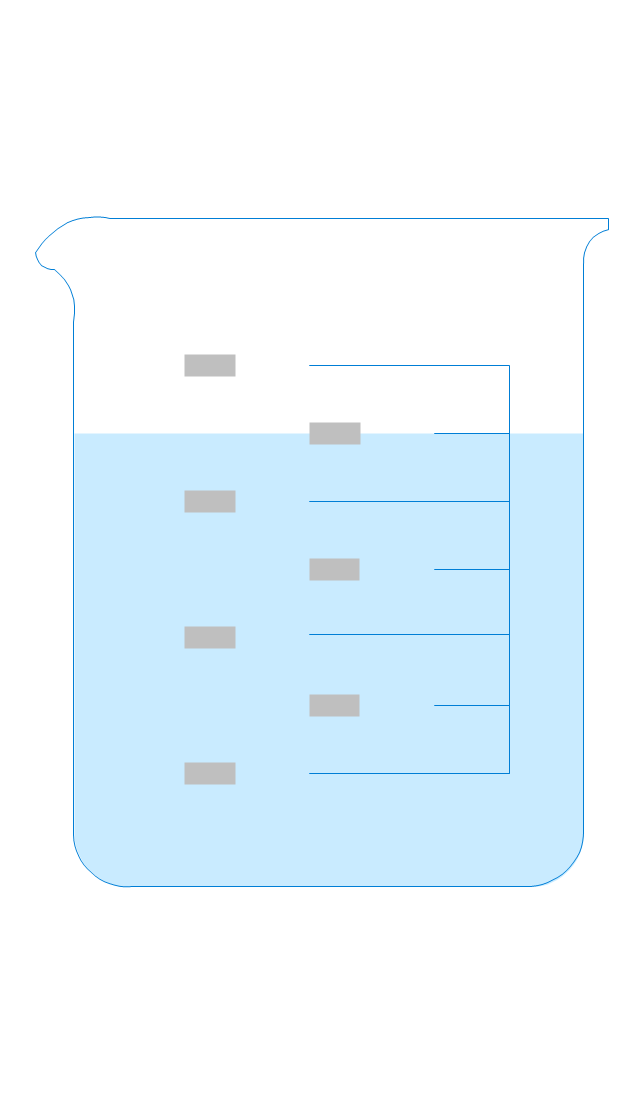
Beaker 500ml, empty

Erlenmeyer flask 250ml, filled
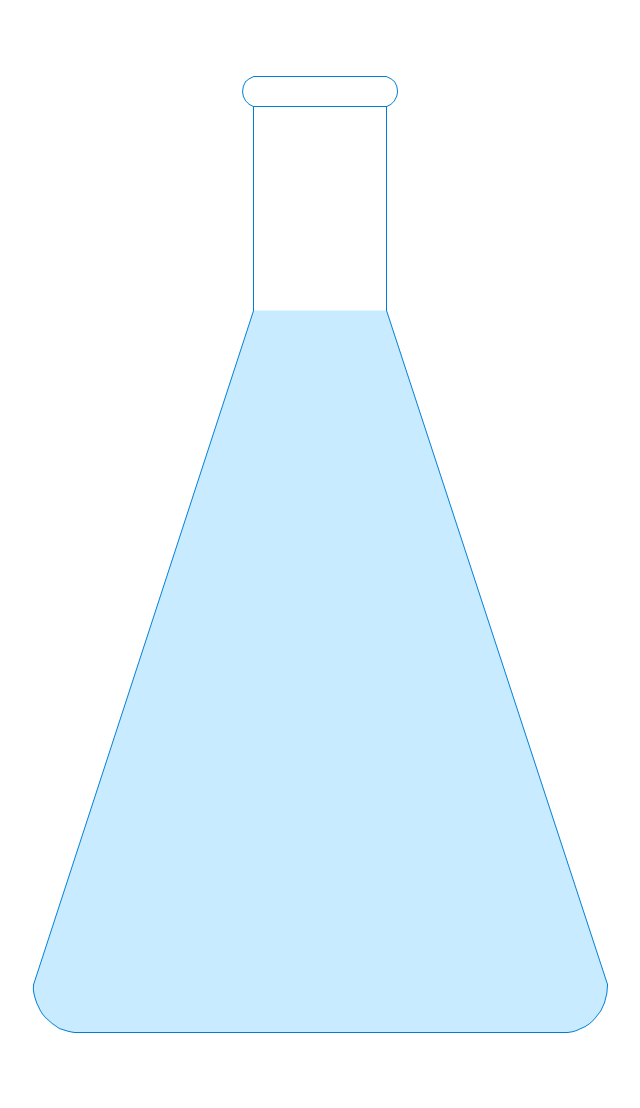
Erlenmeyer flask 250ml, empty

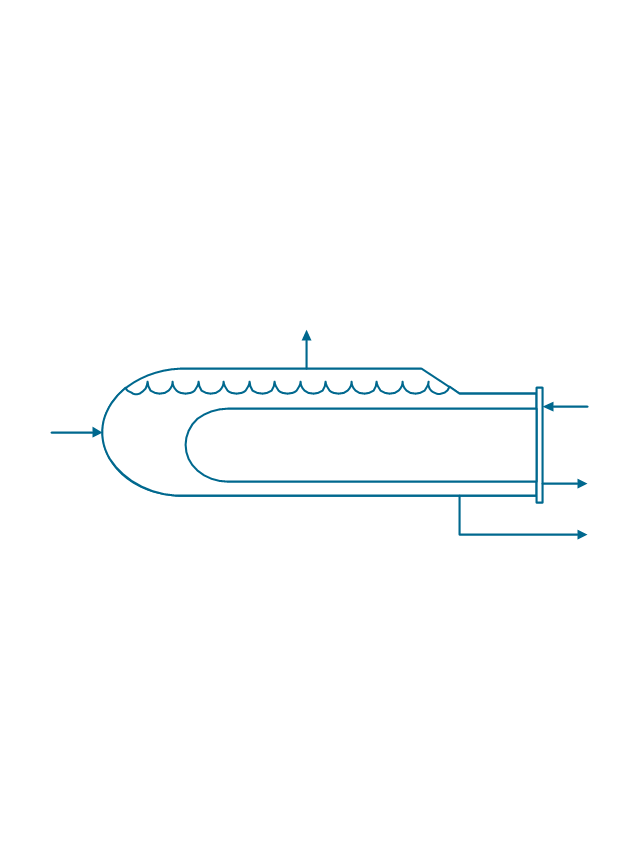
The vector stencils library "Heating equipment" contains 42 symbols of regenerators, intercoolers, heaters, and condensers.
Use these shapes for drawing cooling systems, heat recovery systems, thermal, heat transfer and mechanical design, and process flow diagrams (PFD) in the ConceptDraw PRO software extended with the Chemical and Process Engineering solution from the Chemical and Process Engineering area of ConceptDraw Solution Park.
www.conceptdraw.com/ solution-park/ engineering-chemical-process
Heat exchanger 3

Heat exchanger 1

Heat exchanger 2

Tube bundle, floating head

U-Tube bundle

Tube bundle

Shell and tube
Kettle reboiler

Plate type

Finned tube

Double pipe type

Oil burner

Boiler

Fired heater

Cooling tower 2

Cooling tower 1

Cooling tower 3

Condenser

Automatic stoker

Refrigerator

Direct refrigerator

Indirect refrigerator

Evaporative condenser

Condenser (air cooled)
-heating-equipment---vector-stencils-library.png--diagram-flowchart-example.png)
Oil separator

Chilling evaporator

Air cooling evaporator

Extractor hood (slot)
-heating-equipment---vector-stencils-library.png--diagram-flowchart-example.png)
Extractor hood (open)
-heating-equipment---vector-stencils-library.png--diagram-flowchart-example.png)
Autoclave (propeller)
-heating-equipment---vector-stencils-library.png--diagram-flowchart-example.png)
Autoclave (anchor)
-heating-equipment---vector-stencils-library.png--diagram-flowchart-example.png)
Autoclave (helical)
-heating-equipment---vector-stencils-library.png--diagram-flowchart-example.png)
Autoclave with motor (helical)
-heating-equipment---vector-stencils-library.png--diagram-flowchart-example.png)
Autoclave with motor (anchor)
-heating-equipment---vector-stencils-library.png--diagram-flowchart-example.png)
Autoclave with motor (propeller)
-heating-equipment---vector-stencils-library.png--diagram-flowchart-example.png)
Fan blades horizontal

Fan blades vertical

Fan blades (4)
-heating-equipment---vector-stencils-library.png--diagram-flowchart-example.png)
Triple fan blades

Air-blown cooler

Condenser

Heater / Cooler

The vector stencils library "Industrial equipment" contains 81 symbols of pumps, compressors, fans, turbines, and power generators.
Use these shapes to design pumping systems, air and fluid compression systems, and industrial process diagrams.
"Process engineering focuses on the design, operation, control, and optimization of chemical, physical, and biological processes. Process engineering encompasses a vast range of industries, such as chemical, petrochemical, mineral processing, advanced material, food, pharmaceutical, and biotechnological industries. The application of systematic computer-based methods to process engineering is process systems engineering." [Process engineering. Wikipedia]
The example "Design elements - Industrial equipment" was created using the ConceptDraw PRO diagramming and vector drawing software extended with the Chemical and Process Engineering solution from the Engineering area of ConceptDraw Solution Park.
Industrial equipment symbols
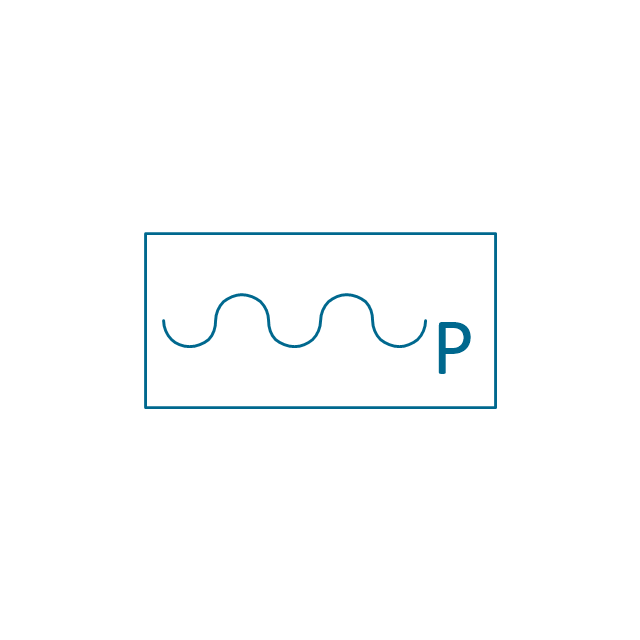
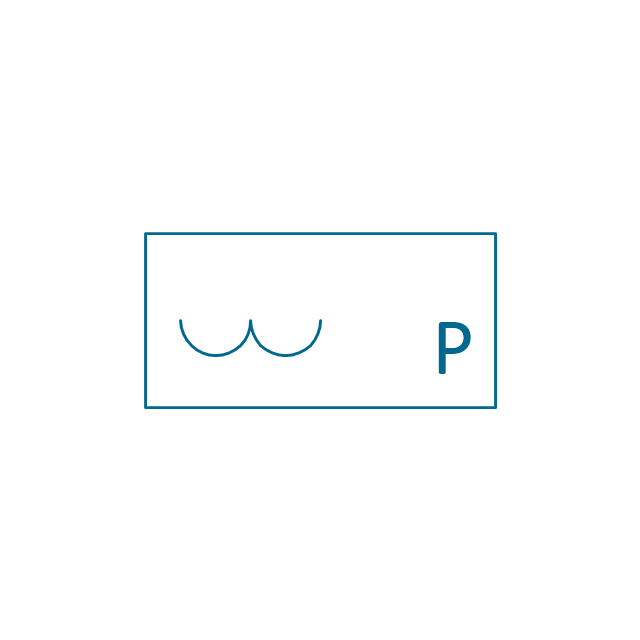
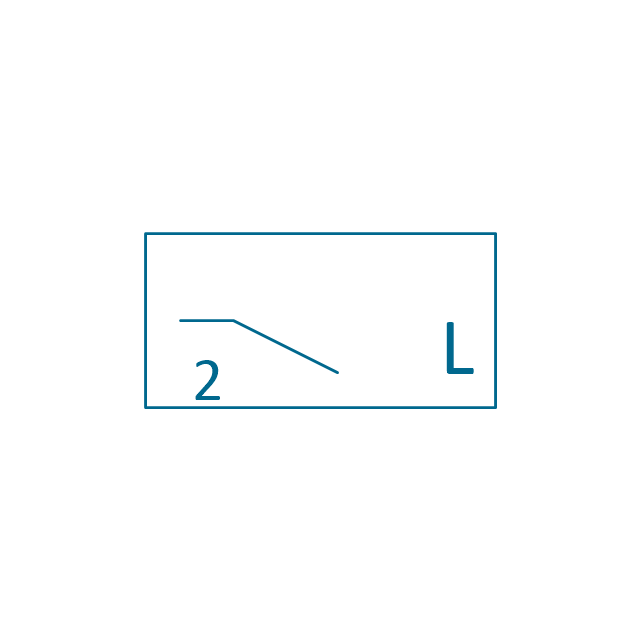
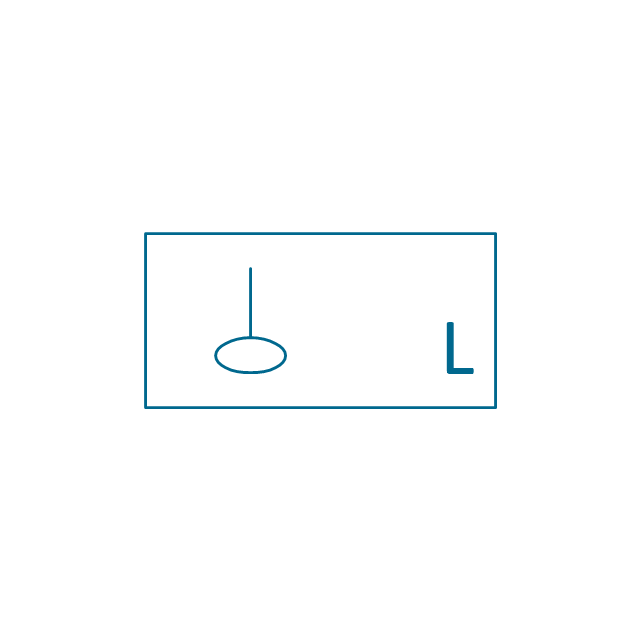
The vector stencils library "Instruments" contains 72 symbols of control instruments and measuring devices: meters and gauges, and callouts, text boxes, and inserts.
Use these shapes to create annotated process flow diagrams (PFD), flow control, manufacturing processes, and distribution system diagrams in the ConceptDraw PRO software extended with the Chemical and Process Engineering solution from the Chemical and Process Engineering area of ConceptDraw Solution Park.
www.conceptdraw.com/ solution-park/ engineering-chemical-process
Indicator local

Indicator remote

Indicator auxiliary
CRT local

CRT remote

CRT auxiliary
PLC local

PLC auxiliary

PLC remote

Computer local

Computer auxiliary

Computer remote

Light local

Light remote

Light auxiliary
Indicator auxiliary (dashed)
-instruments---vector-stencils-library.png--diagram-flowchart-example.png)
Indicator remote (dashed)
-instruments---vector-stencils-library.png--diagram-flowchart-example.png)
Steam traced auxiliary

Steam traced remote

Steam traced local

Level meter auxiliary

Level meter remote

Level meter local

Pressure gauge diaphragm
Pressure gauge

Pressure gauge liquid filled
Strain gauge

Thermometer bi-metallic

Thermometer gas

Thermometer general

Thermometer glass

Thermometer liquid

Thermometer resistance

Thermometer thermocouple

Flowmeter electromagnetic

Flowmeter general

Flowmeter nozzle

Flowmeter orifice

Flowmeter positive displacement

Flowmeter turbine

Flowmeter variable area

Flowmeter Venturi

Level meter capacitive

Level meter conductive
Level meter displacer

Level meter float
Level meter general

Level meter sonic

Indicator analoque

Indicator digital

Indicator general

Recorder analoque

Recorder digital

Recorder general

Converter
Converter 2 (1st half filled)
-instruments---vector-stencils-library.png--diagram-flowchart-example.png)
Converter 3 (2nd half filled)
-instruments---vector-stencils-library.png--diagram-flowchart-example.png)
Venturi

Venturi (pressure taps)
-instruments---vector-stencils-library.png--diagram-flowchart-example.png)
Flowmeter

Rotameter

Vortex sensor

Propeller meter

Generic utility

Operator box

Operator box 2 (1st half filled)
-instruments---vector-stencils-library.png--diagram-flowchart-example.png)
Operator box 3 (2nd half filled)
-instruments---vector-stencils-library.png--diagram-flowchart-example.png)
AND gate

OR gate

NOT gate

Correcting element

Diamond

- Process Flow Diagram Symbols | Chemical Engineering | How to ...
- Chemical Process Flow Diagram Software Free Download
- Process Flow Diagram Symbols | Visio Chemical Engineering Shapes
- Process Flow Diagram Symbols | Chemical Process Symbols
- Process Flow Diagram Symbols | Process Flowchart | Chemical ...
- Chemistry | Basic Diagramming | Basic Diagramming Flowchart ...
- Chemical and Process Engineering | How to Draw a Chemical ...
- Chemical and Process Engineering | Cross-Functional Flowchart ...
- How to Draw a Chemical Process Flow Diagram | Chemical and ...
- How to Draw a Chemical Process Flow Diagram | Cross-Functional ...