Flow Chart in Chemistry
Flow charts are used in chemistry to draw chemical processes. This simplifies the understanding of the basic structure of a system, its components, and interactions, materials flow throughout a process. The simplest form of a Flow diagram is a Block flow diagram, where blocks are used to represent the single pieces of equipment, process stages, operations, sectors, or the entire departments of the enterprise when it has a complex structure. Material flows are indicated by straight lines with arrows, which show the direction of flow.
Flow charts help to standardize and document processes to be presented to workers in order to make the overview of the operation of a chemical facility, its operation zones, products, and other important and critical points.
Chemistry uses a lot of diagram types. The representation of structural formulas for organic compounds in diagrams is visual and incredibly important in the chemistry industry. Visualization of a three-dimensional structure is also illustrative.
Kekule formula is one of the ways to show the structure of molecules and chemical compounds and explain their properties. It shows the atoms of the molecule and how they are bonded (single, double, or triple covalent bonds) by the corresponding number of lines. One line corresponds to single covalent bond, two to double, tree to triple respectively.
Shorthand formulas are used for complex organic compounds. They show the structure and order of the atoms in a compound and are simplified through the replacement of the carbon atoms by the crossing of lines. The hydrogen isn't displayed although the hydrogen atoms are connected with carbon atoms by four bonds. All other atoms connected to carbon atoms are indicated in a diagram.
Lewis structures or Lewis dot formulas are chemical diagrams, which show the position of atoms in a molecule using their chemical symbols and covalent bonding of them using pairs of dots. They show the arrangement of valence electrons around atoms in a molecule. Excess electrons that form lone pairs are also included and shown by pairs of dots near the atoms. These structures are based on the Octet Rule, which tells that most atoms have eight electrons on the outer shell and gain, lose, share electrons, and bond with other atoms exactly on this outer shell.
Condensed structural formulas are another structural type used in chemistry. They are arranged in a single line and also show the molecule's structure and how the atoms are ordered.
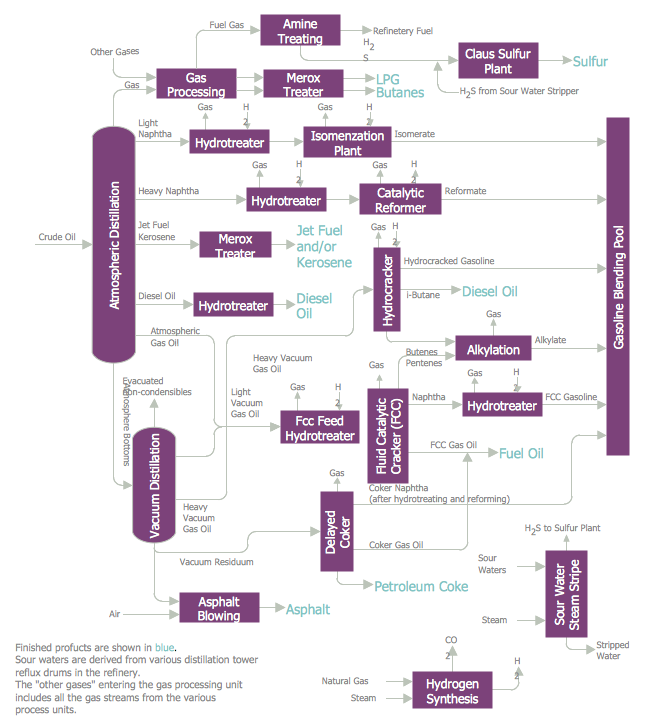
Example 1. Flow Chart in Chemistry
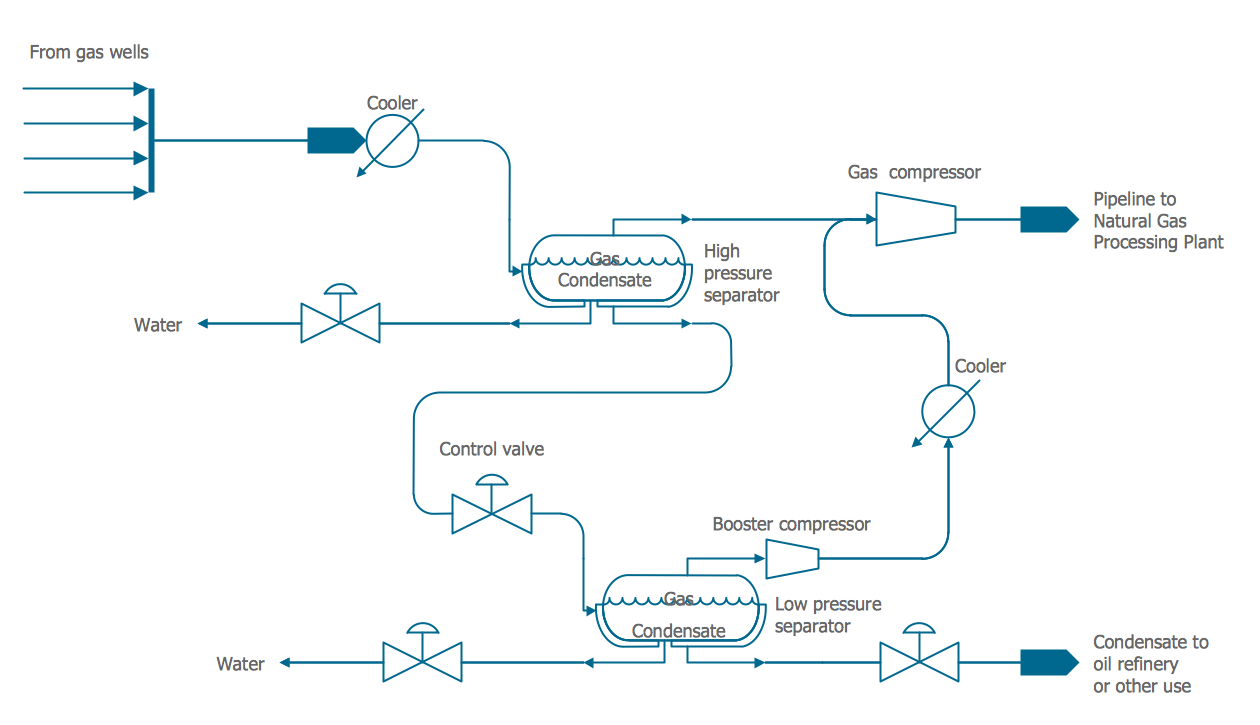
ConceptDraw DIAGRAM software extended with Chemical and Process Engineering solution is the easiest for using a multifunctional diagramming tool, which will help to create a Flow Chart in chemistry, Chemistry diagrams of any type, and Chemistry flow diagrams with ease. This solution offers 8 libraries full of ready-to-use chemical vector design objects, symbols, and pictograms making the drawing process as simple as possible. You can illustrate any chemical processes in a few minutes, including refinery processes, distillation, the release of natural gas condensate, and many more.
- Chemical and Process Engineering
- Process Annotations
- Instruments
- Valves and Fittings
- Heating Equipment
- Industrial Equipment
- Vessels
- Pumps

Example 2. Conventional Merox Process Unit for Sweetening Jet Fuel or Kerosene
The ready-made samples included in Chemical and Process Engineering solution are also helpful for using as examples and a base for your own charts. They are available for all ConceptDraw DIAGRAM users from the ConceptDraw STORE. And finally, the application supports exporting in multiple formats and sharing your work with others directly from ConceptDraw DIAGRAM.

Example 3. Chemical and Process Engineering Solution in ConceptDraw STORE
The set of Process Diagrams you see on this page was created in ConceptDraw DIAGRAM software using the Chemical and Process Engineering Solution. These samples successfully demonstrate solution's capabilities and professional results you can achieve. An experienced user spent 10-20 minutes creating each of them.
Use the Chemical and Process Engineering Solution for ConceptDraw DIAGRAM software to create your own professional-looking Process Diagrams of any complexity quick, easy and effective, and then successfully use them in your work and scientific activity.
All source documents are vector graphic documents. They are available for reviewing, modifying, or converting to a variety of formats (PDF file, MS PowerPoint, MS Visio, and many other graphic formats) from the ConceptDraw STORE. The Chemical and Process Engineering Solution is available for all ConceptDraw DIAGRAM users.