Chemical Engineering Flow Chart
Flow charts are successfully applied in many fields, including chemical engineering and industrial engineering, for which they were initially developed. Currently, the list of areas for use is continuously extended. Flow charts give an overall overview of the entire process or its parts for the stakeholders of varied levels. They help to identify unnecessary steps, redundancies, repetitive tasks, bottlenecks, and other flaws in order to improve the process efficiency. Because improving processes is critical for the enterprise's success and contributes to getting work done faster and of high quality.
Chemical Engineering Flow Chart is a way of standardizing chemical processes, it shows the series of steps and clears the order of execution tasks of technological processes. It helps the working personnel to analyze, streamline, and optimize processes, uncover process risks, and make necessary changes and improvements. This prevents personnel from errors, allows efficient communication by having actual visualized information, and helps avoid confusion. It is especially important when a new or unfamiliar process is explored. As a result, highly efficient process execution is provided.
Different kinds of flow diagrams (block flow diagrams, flow sheets or process flow diagrams) are used depending on the level of information necessary to be presented.
Block flow diagram (BFD) is a drawing of a chemical process used to visualize the basic structure of a system. Blocks can show single pieces of equipment or the entire plant. Often they help to break up a complicated system or complex process into a simple sequence of stages.
Process flow diagrams (PFDs) or flowsheets are also widely used in chemical engineering. They show the general flow of plant processes and equipment, and how different parts of the process are interconnected with each other. Schematically the process steps are usually shown by rectangles, the lines connecting them show the path or flow. As a rule, the diagrams for the parts of the process are more detailed than ones representing an overall process.
Flow charts and their subtype flow sheets are useful for chemical engineers and technologists to show the essential steps of the chemical technological processes, the results of their execution, and the description of actual process conditions. They help to organize the tasks in chronological order, by type, process, decision, etc.
Example 1. Chemical Engineering Flow Chart
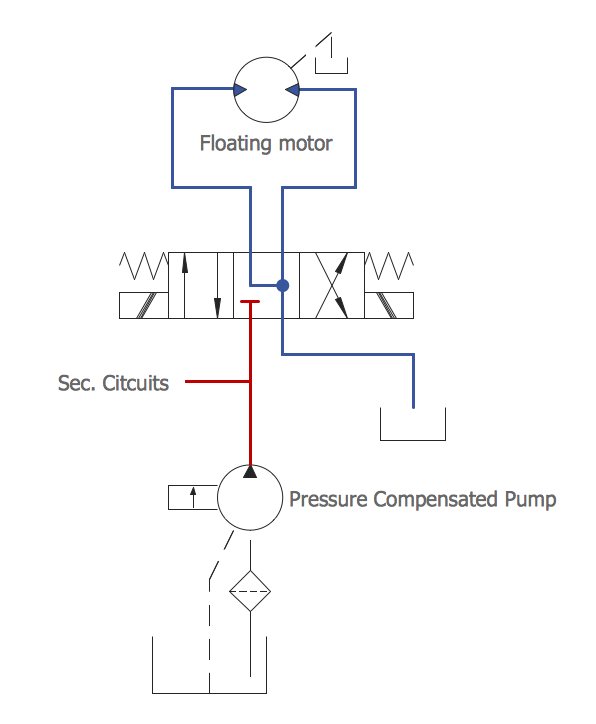
Design efficiently the Process flowcharts to standardize and visualize chemical processes, chemical structures, chemical reactions, chemical technologies, and streamline processes with a powerful drawing tool ConceptDraw DIAGRAM enhanced with Chemical and Process Engineering solution for professional chemists, students, lectors, and other stakeholders. Use effectively a series of predesigned symbols and notations from the solution libraries corresponding to the International Organization for Standardization (ISO). Professionally design accurate Chemical Engineering Flow Charts and use them to document chemistry research, predict properties and effects, and easier for any stakeholder to follow your Process Flow Chart without additional instructions.

Example 2. Industrial Equipment Library Design Elements
Chemical and Process Engineering solution provides 8 libraries with 450+ predesigned vector elements, symbols, pictograms, and design elements — process annotation, which are useful for easy drawing chemical process diagrams and flow charts:
- Chemical and Process Engineering
- Heating Equipment
- Industrial Equipment
- Instruments
- Process Annotations
- Pumps
- Valves and Fittings
- Vessels

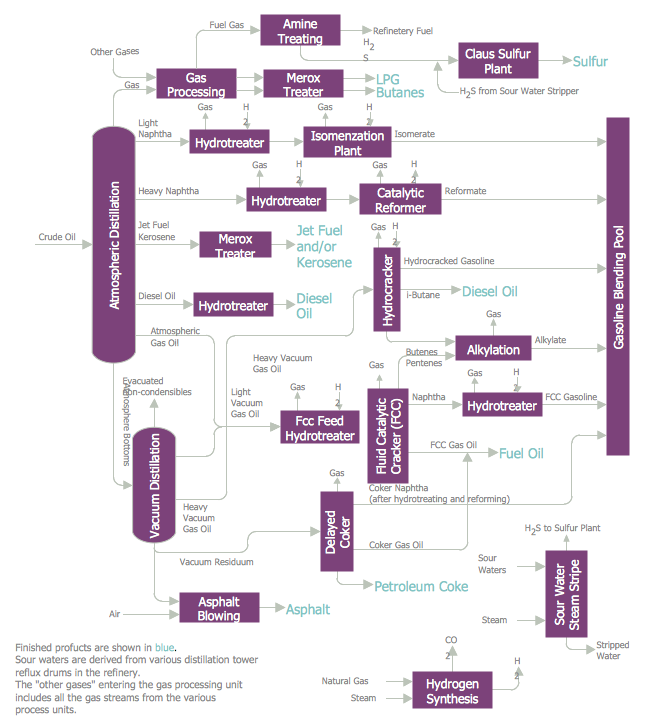
Example 3. Chemical Engineering Flow Chart - Crude Oil Distillation
The set of Process Diagrams you see on this page was created in ConceptDraw DIAGRAM software using the Chemical and Process Engineering Solution. These samples successfully demonstrate solution's capabilities and professional results you can achieve. An experienced user spent 10-20 minutes creating each of them.
Use the Chemical and Process Engineering Solution for ConceptDraw DIAGRAM software to create your own professional-looking Process Diagrams of any complexity quick, easy and effective, and then successfully use them in your work and scientific activity.
All source documents are vector graphic documents. They are available for reviewing, modifying, or converting to a variety of formats (PDF file, MS PowerPoint, MS Visio, and many other graphic formats) from the ConceptDraw STORE. The Chemical and Process Engineering Solution is available for all ConceptDraw DIAGRAM users.