Target Diagram

Circular Diagram

The Circular Flow Diagram

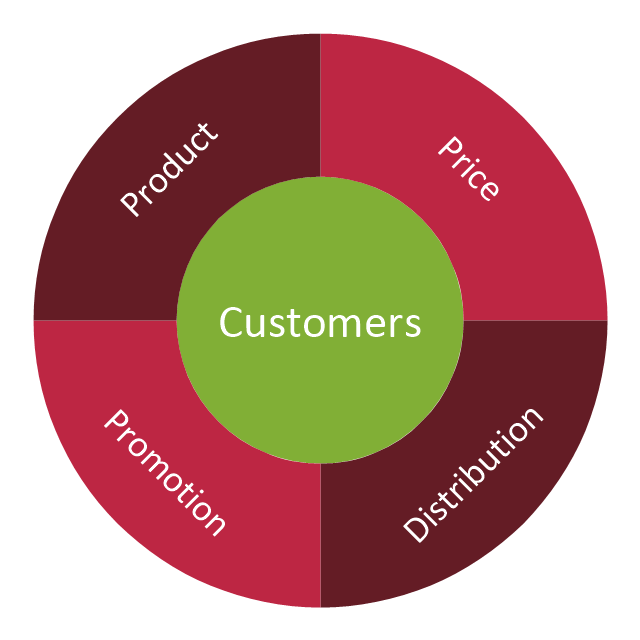
"The marketing mix is a business tool used in marketing and by marketing professionals. The marketing mix is often crucial when determining a product or brand's offer, and is often synonymous with the four Ps: price, product, promotion, and place ..." [Marketing mix. Wikipedia]
The example of wheel diagram (ring diagram, bevel style circle diagram, circular diagram) "Marketing mix" was created using the ConceptDraw PRO diagramming and vector drawing software extended with the Target and Circular Diagrams solution from the Marketing area of ConceptDraw Solution Park.
www.conceptdraw.com/ solution-park/ marketing-target-and-circular-diagrams
Marketing mix - Wheel diagram
Competitor Analysis

Daily Schedule Chart

Business Productivity - Marketing

Flowchart Examples and Templates

Sales Process Flowchart Symbols

Flow chart Example. Warehouse Flowchart


Flow Map

How to Create a Social Media DFD Flowchart

The vector stencils library "Target diagrams" contains 13 templates of target diagrams: marketing mix diagram, principles of marketing diagram, circle diagram, macro-micro environment diagram, stakeholder diagram, target market scope diagram.
Use these shapes to illustrate your marketing and sales documents, presentations, webpages and infographics in the ConceptDraw PRO diagramming and vector drawing software extended with the Target and Circular Diagrams solution from the Marketing area of ConceptDraw Solution Park.
www.conceptdraw.com/ solution-park/ marketing-target-and-circular-diagrams
Principles of marketing by Ph. Kotler

Marketing mix

Target

Principles of marketing by Ph. Kotler (prompt)
-target-diagrams---vector-stencils-library.png--diagram-flowchart-example.png)
Circle diagram

Macro-micro environmental forces diagram

Macro-micro environmental forces diagram (prompt)
-target-diagrams---vector-stencils-library.png--diagram-flowchart-example.png)
Stakeholder diagram

Target market scope diagram

Target diagram 1

Target diagram 2

Target diagram 3

Target diagram

The vector stencils library "Sales KPIs and Metrics" contains 15 chart templates and graphic indicators of sales key performance indicators (KPIs) and metrics for drawing sales dashboards: line charts "Cost per order" and "Clicks from Sales Follow-Up Emails", column charts "Social Media Usage" and "Usage Rate of Marketing Collateral", horizontal bar charts "Rate of Follow Up Contact", "Cost per customer" and "Lead Response Time", pie charts "Product mix", "Product Performance" and "Rate of Contact", gauge (speedometer) indicators "Sales Growth" and "Actual vs Plan", bullet indicator "Sales Target", diamond alarm indicators "Average Purchase Value", "Quote to Close Ratio", "Opportunity-to-Win Ratio" and "Sales Ratio".
The dashboard charts and indicators example "Design elements - Sales KPIs and metrics" for the ConceptDraw PRO diagramming and vector drawing software is included in the Sales Dashboard solution from the Marketing area of ConceptDraw Solution Park.
www.conceptdraw.com/ solution-park/ marketing-sales-dashboard
Sales dashboard charts and graphic indicators

Bar Diagrams for Problem Solving. Create space science bar charts with Bar Graphs Solution

- Marketing mix - Wheel diagram | Target diagrams - Vector stencils ...
- Marketing mix - Wheel diagram | Marketing Diagrams | Marketing ...
- Flowchart Marketing Process. Flowchart Examples | Marketing ...
- Schematic Diagram Of The Export Marketing Mix
- Marketing mix - Wheel diagram | Target Diagram | Daily Schedule ...
- Marketing mix - Wheel diagram | Target market | Use of social media ...
- Marketing mix - Wheel diagram | Target market | Competitor Analysis ...
- Flow Chart Of Product Mix
- Marketing | Marketing mix - Wheel diagram | Target market ...
- Marketing mix diagram | Sales Process Flowchart Symbols | How to ...
- Marketing mix - Wheel diagram
- Marketing Diagrams | Marketing mix - Wheel diagram | Circle-spoke ...
- Marketing mix - Wheel diagram | Marketing mix diagram | Target ...
- Flowchart Marketing Mix
- Marketing Diagrams | Marketing mix - Wheel diagram | Block ...
- Marketing mix - Wheel diagram
- Diagram For Marketing Mix
- Marketing mix - Wheel diagram | Marketing | Competitor Analysis ...
- Marketing mix - Wheel diagram | Competitor Analysis | Marketing ...
- Marketing mix - Wheel diagram | Sales KPIs and Metrics - Vector ...