 Marketing Diagrams
Marketing Diagrams solution extends ConceptDraw DIAGRAM diagramming software with abundance of samples, templates and vector design elements intended for easy graphical visualization and drawing different types of Marketing diagrams and graphs, including Branding Strategies Diagram, Five Forces Model Diagram, Decision Tree Diagram, Puzzle Diagram, Step Diagram, Process Chart, Strategy Map, Funnel Diagram, Value Chain Diagram, Ladder of Customer Loyalty Diagram, Leaky Bucket Diagram, Promotional Mix Diagram, Service-Goods Continuum Diagram, Six Markets Model Diagram, Sources of Customer Satisfaction Diagram, etc. Analyze effectively the marketing activity of your company and apply the optimal marketing methods with ConceptDraw DIAGRAM software.
This circular diagram sample was created on the base of the figure from the Florence-Darlington Technical College website. [bus.fdtc.edu/ sbed/ core/ core7.html]
"A marketing plan may be part of an overall business plan. Solid marketing strategy is the foundation of a well-written marketing plan. While a marketing plan contains a list of actions, a marketing plan without a sound strategic foundation is of little use. ...
A marketing plan for a small business typically includes Small Business Administration Description of competitors, including the level of demand for the product or service and the strengths and weaknesses of competitors:
(1) Description of the product or service, including special features.
(2) Marketing budget, including the advertising and promotional plan.
(3) Description of the business location, including advantages and disadvantages for marketing.
(4) Pricing strategy.
(5) Market Segmentation." [Marketing plan. Wikipedia]
The circular diagram example "Marketing plan" was created using the ConceptDraw PRO diagramming and vector drawing software extended with the Target and Circular Diagrams solution from the Marketing area of ConceptDraw Solution Park.
www.conceptdraw.com/ solution-park/ marketing-target-and-circular-diagrams
Circular diagram

How to Use the ″Online Store PR Campaign″ Sample

This circle-spoke diagram sample illustrates the target market concept.
"A target market is a group of customers towards which a business has decided to aim its marketing efforts and ultimately its merchandise. A well-defined target market is the first element to a marketing strategy. The marketing mix variables of product, place (distribution), promotion and price are the four elements of a marketing mix strategy that determine the success of a product in the marketplace." [Target market. Wikipedia]
The hub-and-spoke diagram example "Target market" was created using the ConceptDraw PRO diagramming and vector drawing software extended with the Circle-Spoke Diagrams solution from the area "What is a Diagram" of ConceptDraw Solution Park.
Circle-spoke diagram

Competitor Analysis

"A target market is a group of customers that the business has decided to aim its marketing efforts and ultimately its merchandise towards. A well-defined target market is the first element to a marketing strategy. The marketing mix variables of product, place (distribution), promotion and price are the four elements of a marketing mix strategy that determine the success of a product in the marketplace." [Target market. Wikipedia]
"An onion diagram is a kind of chart that shows the dependencies among parts of an organization or process. The chart displays items in concentric circles, where the items in each ring depend on the items in the smaller rings. ...
The Onion Diagram is able to show layers of a complete system in a few circles. Each of the circles is able to represent a component that is dependent upon the component on the inside of it shown by the circle inside of it. The main concept of the diagram is shown by the center circle of the diagram. This chart is used due to the fact that it has a clear visual representation that is easy to read, and it has a strong visual impact." [Onion diagram. Wikipedia]
This onion diagram (target diagram) example "Target market" was created using the ConceptDraw PRO diagramming and vector drawing software extended with the Target and Circular Diagrams solution from the Marketing area of ConceptDraw Solution Park.
www.conceptdraw.com/ solution-park/ marketing-target-and-circular-diagrams
Onion diagram

How to Create a Social Media DFD Flowchart

How to Connect Social Media DFD Flowchart with Action Maps

 Fishbone Diagrams
The Fishbone Diagrams solution extends ConceptDraw DIAGRAM software with the ability to easily draw the Fishbone Diagrams (Ishikawa Diagrams) to clearly see the cause and effect analysis and also problem solving. The vector graphic diagrams produced using this solution can be used in whitepapers, presentations, datasheets, posters, and published technical material.
Entity-Relationship Diagram (ERD) with ConceptDraw DIAGRAM


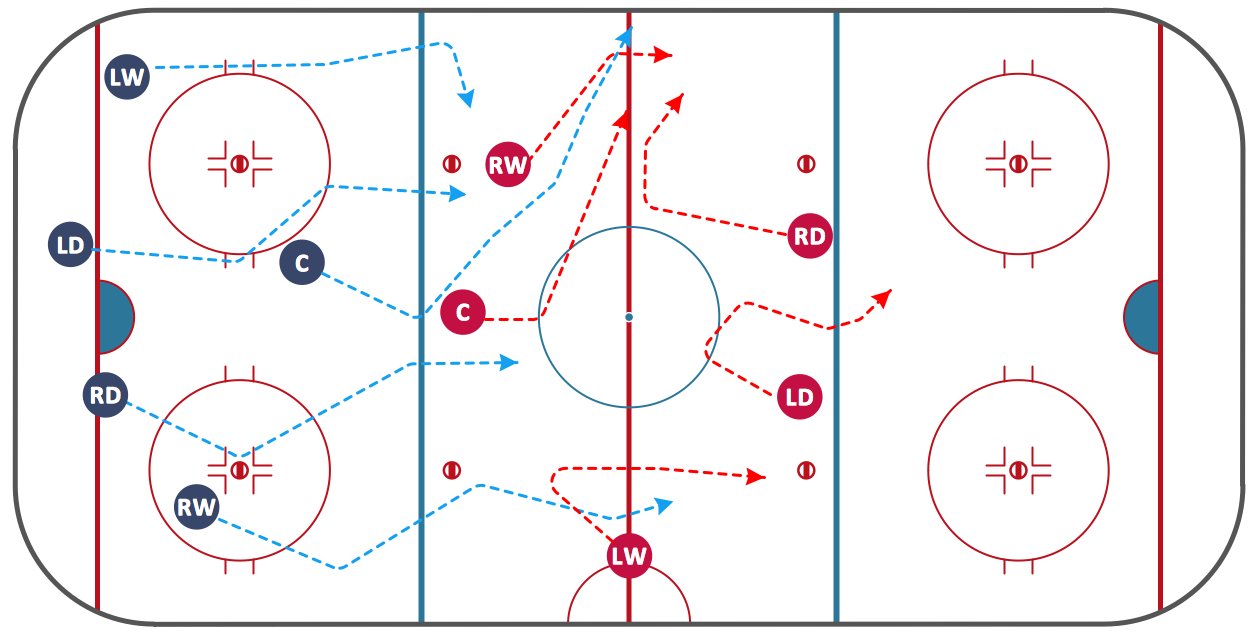
Ice Hockey Diagram — Defensive Strategy — Neutral Zone Trap
- Example Of Promotional Mix
- Elements Of Promotion Mix With Examples
- Marketing Diagrams | Six Elements Of Promotion Mix Diagram
- Six Elements Of Promotion Mix
- Marketing Diagrams | Promotional Mix Graph
- Marketing mix - Wheel diagram | Target market | Competitor Analysis ...
- Marketing Diagrams | Competitor Analysis | Marketing mix - Wheel ...
- Promotional Mix Examples
- Promotion Mix Chart Or Graph
- Marketing Diagrams | Graph Of Promotional Mix
- Marketing mix - Wheel diagram | Marketing Diagrams | Promotion ...
- Marketing mix - Wheel diagram | Target diagrams - Vector stencils ...
- Promotion Mix Example
- UML Class Diagram Example - Buildings and Rooms | Competitor ...
- Marketing mix - Wheel diagram | Target market | Use of social media ...
- Graphs On Marketing Mix
- Marketing Mix Flow Chart
- Marketing Diagrams | Promotional Mix
- Promotional Mix In Marketing