Winter Sports. Olympic Games Infographics. Medal Table

Winter Sports. Olympic Games Illustrations. Medal Summary

Sport pictograms. Olympic Games

Winter Sports Vector Clipart. Medal Map. Spatial Infographics

 Winter Sports
The Winter Sports solution from Sport area of ConceptDraw Solution Park contains winter sports illustration examples, templates and vector clipart libraries.
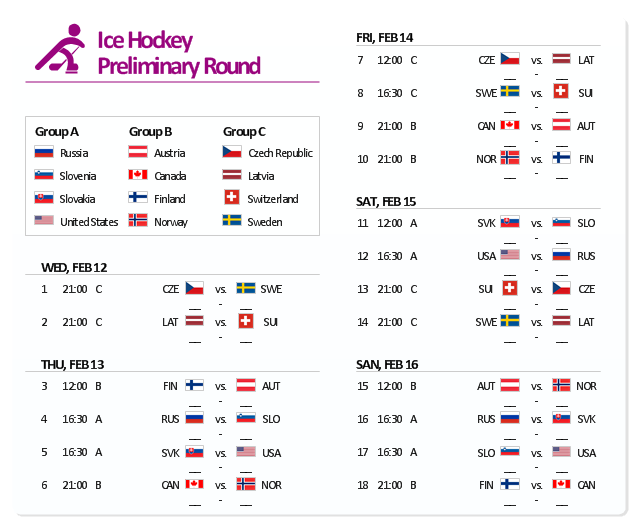
The example "Sochi 2014 Olympics - Men’s hockey tournament schedule" represent Ice Hockey schedule of XXII Olympic Winter Games according to Sochi2014.com website. [sochi2014.com/ en/ ice-hockey-schedule-and-results]
"The 2014 Winter Olympics, officially the XXII Olympic Winter Games, or the 22nd Winter Olympics, are scheduled to take place from 6 to 23 February 2014, in Sochi, Russia, with some events held in the resort town of Krasnaya Polyana. Ninety-eight events in fifteen winter sports will be held. Both the Olympics and 2014 Winter Paralympics are being organized by the Sochi Organizing Committee (SOC). ...
The events of the 2014 Winter Olympics will be held around two clusters of new venues; an Olympic Park was constructed in the Imeretinsky Valley on the coast of the Black Sea, with Fisht Olympic Stadium and the Games' indoor venues located within walking distance, and snow events will be held at Krasnaya Polyana." [2014 Winter Olympics. Wikipedia]
The example "Sochi 2014 Olympics - Men’s hockey tournament schedule" was created using the ConceptDraw PRO diagramming and vector drawing software extended with the Winter Sports solution. The Winter Sports solution from the Sport area of ConceptDraw Solution Park contains the vector stencils library "Winter sports pictograms" and examples of diagrams and infographics.
Men’s hockey tournament schedule
Spatial infographics Design Elements: Transport Map

Winter Sports. Using Winter Sports Design Elements Producing Infographics

Design Pictorial Infographics. Design Infographics

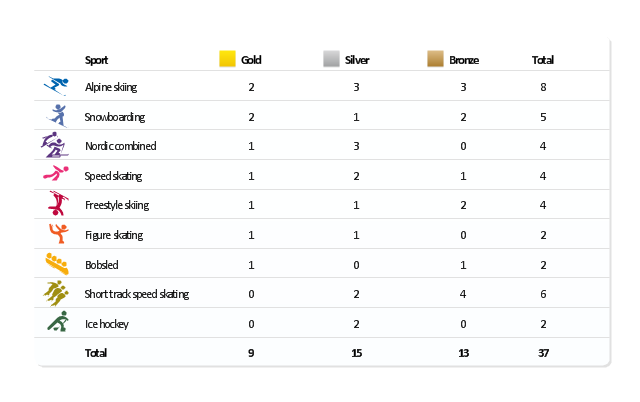
"The United States participated in the 2010 Winter Olympics in Vancouver, British Columbia, Canada. The U.S. team had a historic Winter Games, winning an unprecedented 37 medals. Team USA's medal haul, which included nine gold, marked the first time since the 1932 Lake Placid Games that the U.S. earned more medals than any other participant. ...
The United States finished the 2010 Olympic Games by setting a new record for the most medals won by a single country at a Winter Olympics. The previous record of 36 was set by Germany at the 2002 Winter Olympics; with the silver medal won by the men's hockey team in the final Olympic event of 2010, the U.S. earned their 37th medal of the Vancouver Games. In addition, the U.S. team set a Winter Games record for bronze medals with 13, and the 15 silver medals by the U.S. was second only to the record of 16 set by Germany in 2002." [United States at the 2010 Winter Olympics. Wikipedia]
This medal table example "US at the 2010 Winter Olympics" is created using the ConceptDraw PRO diagramming and vector drawing software extended with the Winter Sports solution.
The Winter Sports solution from the Sport area of ConceptDraw Solution Park contains the vector stencils library "Winter sports pictograms" and examples of diagrams and infographics.
Medal table
Winter Sports. Illustrations and Visualize Statistics

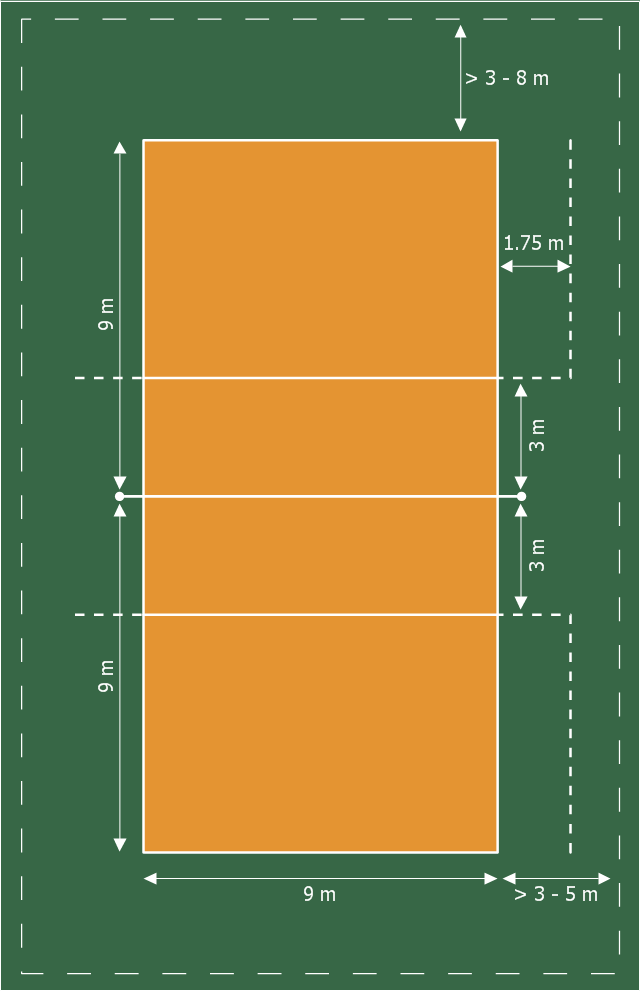
This sport field plan sample was designed on the base of the Wikipedia file: VolleyballCourt.svg. [en.wikipedia.org/ wiki/ File:VolleyballCourt.svg]
This file is licensed under the Creative Commons Attribution-Share Alike 3.0 Unported license. [creativecommons.org/ licenses/ by-sa/ 3.0/ deed.en]
"Volleyball is a team sport in which two teams of six players are separated by a net. Each team tries to score points by grounding a ball on the other team's court under organized rules. It has been a part of the official program of the Summer Olympic Games since 1964. ...
The court dimensions.
A volleyball court is 18 m (59 ft) long and 9 m (29.5 ft) wide, divided into 9 m × 9 m halves by a one-meter (40-inch) wide net. The top of the net is 2.43 m (8 ft 0 in) above the center of the court for men's competition, and 2.24 m (7 ft 4 in) for women's competition, varied for veterans and junior competitions.
The minimum height clearance for indoor volleyball courts is 7 m (23 ft), although a clearance of 8 m (26 ft) is recommended.
A line 3 m (9.84 ft) from and parallel to the net is considered the "attack line". This "3 meter" (or "10-foot") line divides the court into "back row" and "front row" areas (also back court and front court). These are in turn divided into 3 areas each: these are numbered as follows, starting from area "1", which is the position of the serving player.
After a team gains the serve (also known as siding out), its members must rotate in a clockwise direction, with the player previously in area "2" moving to area "1" and so on, with the player from area "1" moving to area "6".
The team courts are surrounded by an area called the free zone which is a minimum of 3 meters wide and which the players may enter and play within after the service of the ball. All lines denoting the boundaries of the team court and the attack zone are drawn or painted within the dimensions of the area and are therefore a part of the court or zone. If a ball comes in contact with the line, the ball is considered to be "in". An antenna is placed on each side of the net perpendicular to the sideline and is a vertical extension of the side boundary of the court. A ball passing over the net must pass completely between the antennae (or their theoretical extensions to the ceiling) without contacting them." [Volleyball. Wikipedia]
The sport field plan example "Volleyball court dimensions" was created using the ConceptDraw PRO diagramming and vector drawing software extended with the Sport Field Plans solution from the Building Plans area of ConceptDraw Solution Park.
Sport field plan
Basketball Field in the Vector

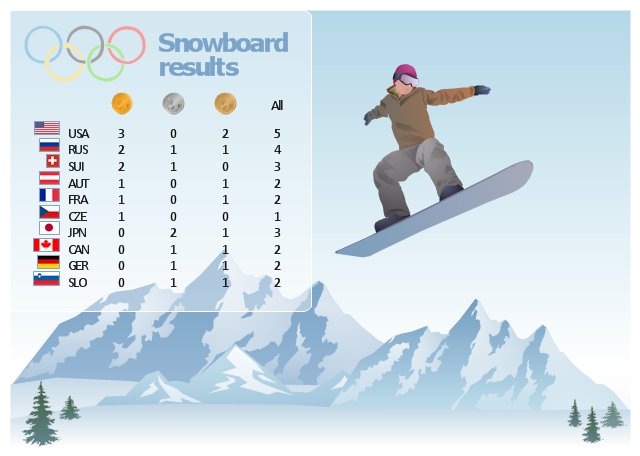
"Snowboarding at the 2014 Winter Olympics in Sochi was held at the Rosa Khutor Extreme Park. The events were held between 6 and 22 February 2014. A total of ten snowboarding events were held at Sochi 2014 which include parallel giant slalom, snowboard cross, half-pipe, and the new events of parallel slalom and slopestyle.
A crash in practice from Norwegian slopestyle snowboarder Torstein Horgmo, who fractured his collarbone, and complaints from other athletes that some jumps were too steep have prompted organizers to modify the slopestyle course in the week before the Games." [Snowboarding at the 2014 Winter Olympics. Wikipedia]
The sport infographics and medal table example "Sochi 2014 Winter Olympics ® - Snowboarding results" was created using the ConceptDraw PRO diagramming and vector drawing software extended with the Winter Sports solution from the Sport area of ConceptDraw Solution Park.
Medal table
Ice Hockey Offside Diagram

- Winter Sports. Olympic Games Infographics. Medal Table | Basic ...
- Sport pictograms. Olympic Games | Design Pictorial Infographics ...
- Pictorial Chart | Sport pictograms. Olympic Games | HR Flowchart ...
- Winter Sports. Olympic Games Infographics. Medal Table | Winter ...
- Winter Sports. Olympic Games Infographics. Medal Table
- Winter Sports | Winter Sports. Olympic Games Illustrations. Medal ...
- Winter Sports. Olympic Games Infographics. Medal Table | Winter ...
- Winter Sports. Using Olympic Games Clipart to Illustrate Tournament ...
- Winter Sports. Olympic Games Illustrations. Medal Summary | Winter ...
- Winter Sports. Olympic Games Infographics. Medal Table | Winter ...
- Sport pictograms. Olympic Games | Winter Sports. Using Winter ...
- Winter Olympics pictograms - Vector stencils library | Winter Sports ...
- Winter Sports. Olympic Games Illustrations. Medal Summary | Sochi ...
- Sport pictograms. Olympic Games | Winter Sports. Using Winter ...
- Winter Sports | Olympic Games Er Diagram Samples
- Winter Olympics - Vector stencils library | Winter Sports | Winter ...
- Winter Olympics - Luge | Winter Sports | Sport pictograms. Olympic ...
- Flow Chart for Olympic Sports | Winter Sports. Olympic Games ...
- Winter Sports. Illustrations and Visualize Statistics | Winter Sports ...
- Sports Brainstorming Examples