 Winter Sports
The Winter Sports solution from Sport area of ConceptDraw Solution Park contains winter sports illustration examples, templates and vector clipart libraries.
Winter Sports. Olympic Games Infographics. Medal Table

Winter Sports Vector Clipart. Medal Map. Spatial Infographics

Winter Sports. Using Winter Sports Design Elements Producing Infographics

Winter Sports. Illustrations and Visualize Statistics

Winter Sports. Olympic Games Illustrations. Medal Summary

Sport pictograms. Olympic Games

Flow Chart for Olympic Sports

Basketball Illustrations

Mind Map Making Software

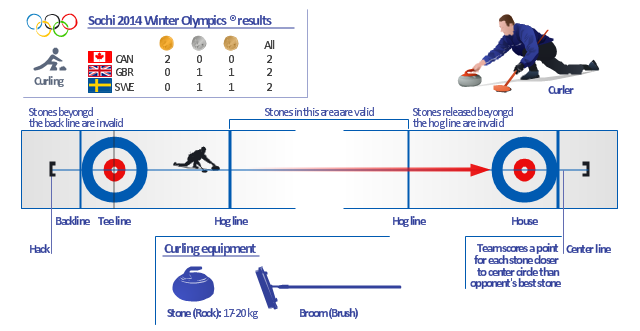
The example infographics "Curling sheet" shows Sochi 2014 Winter Olympics curling medal table, curing sheet scheme, curler and game equipment clipart images.
"The curling competition of the 2014 Winter Olympics was held at the Ice Cube Curling Center, nicknamed "the Ice Cube". It is the sixth time that curling was on the Olympic program. In both the men's and women's competitions, ten nations competed. These two events took place between 10–21 February 2014." [Curling at the 2014 Winter Olympics. Wikipedia]
The sport infographics example "Curling sheet" is created using the ConceptDraw PRO diagramming and vector drawing software extended with the Winter Sports solution from the Sport area of ConceptDraw Solution Park.
Sochi 2014 Winter Olympics curling results - Sport infographics
Spatial infographics Design Elements: Transport Map

Design Pictorial Infographics. Design Infographics

Basketball Field in the Vector

Soccer (Football) Illustrated

- BPR Diagram. Business Process Reengineering Example | Winter ...
- Winter Sports | Student Timetable Schedule In Pie Chart Images
- Clip Art Images Winter Olympics Alpine Skiing
- How to Get Images for Project Presentation on Macintosh | Winter ...
- Flowchart Example : Flow Chart of Marketing Analysis | Winter Sports ...
- Winter Sports Vector Clipart. Medal Map. Spatial Infographics ...
- Curling sheet | Winter Sports | Winter Olympics - Vector stencils ...
- Curling sheet | Christmas and New Year - Vector stencils library ...
- Wheelchair curling - Winter sports pictograms | Curling sheet ...
- Curling Images Clip Art
- Diagram With Pictures Of All The Winter Olympic Events
- Winter Sports. Olympic Games Infographics. Medal Table | Winter ...
- Luge Winter Olympics
- Winter Sports | Images Of People Freestyle Skiing
- Winter Olympics - Vector stencils library | Winter Olympics - Cross ...
- Curling sheet | Wheelchair curling - Winter sports pictograms ...
- Winter Sports Vector Clipart. Medal Map. Spatial Infographics ...
- Winter Sports Vector Clipart. Medal Map. Spatial Infographics | Food ...
- Alpine skiing - Winter sports pictograms | Alpine skiing, paralympic ...
- Winter Olympics - Figure skating | Winter Sports Vector Clipart ...