Pyramid Diagram

HelpDesk
How To Create a Prioritization Matrix
UML Use Case Diagram Example. Social Networking Sites Project

Pyramid Chart Examples

Workflow Diagram

BCG Matrix

Agile Methodology

Competitor Analysis

Product Overview

Pyramid Diagram

This TQM diagram example was redesigned from the illustration of the Highway Performance Monitoring System (HPMS) Field Manual from the website of the Federal Highway Administration (FHWA).
[fhwa.dot.gov/ policyinformation/ hpms/ fieldmanual/ chapter7.cfm]
"Highway Performance Monitoring System (HPMS).
The HPMS is a national level highway information system that includes data on the extent, condition, performance, use and operating characteristics of the nation's highways. The HPMS contains administrative and extent of system information on all public roads, while information on other characteristics is represented in HPMS as a mix of universe and sample data for arterial and collector functional systems. Limited information on travel and paved miles is included in summary form for the lowest functional systems.
HPMS was developed in 1978 as a continuing database, replacing the special biennial condition studies that had been conducted since 1965. The HPMS has been modified several times since its inception. Changes have been made to reflect changes in the highway systems, legislation, and national priorities, to reflect new technology, and to consolidate or streamline reporting requirements." [fhwa.dot.gov/ policyinformation/ hpms.cfm]
The TQM flowchart example "Software workflow diagram" was created using the ConceptDraw PRO diagramming and vector drawing software extended with the Total Quality Management (TQM) Diagrams solution from the Quality area of ConceptDraw Solution Park.
TQM diagram

This example was created on the base of the Georgia DOT Performance Management Dashboard from the Georgia Department of Transportation website.
[dot.ga.gov/ informationcenter/ statistics/ performance/ Pages/ default.aspx]
"Performance management (PM) includes activities which ensure that goals are consistently being met in an effective and efficient manner. Performance management can focus on the performance of an organization, a department, employee, or even the processes to build a product of service, as well as many other areas.
PM is also known as a process by which organizations align their resources, systems and employees to strategic objectives and priorities.
Performance management originated as a broad term coined by Dr. Aubrey Daniels in the late 1970s to describe a technology (i.e. science imbedded in applications methods) for managing both behavior and results, two critical elements of what is known as performance. A formal definition of performance management, according to Daniels' is "a scientifically based, data-oriented management system. It consists of three primary elements-measurement, feedback and positive reinforcement."" [Performance management. Wikipedia]
The meter dashboard example "Georgia DOT Performance Management" was created using the ConceptDraw PRO diagramming and vector drawing software extended with the Meter Dashboard solution from the area "What is a Dashboard" of ConceptDraw Solution Park.
Meter dashboard

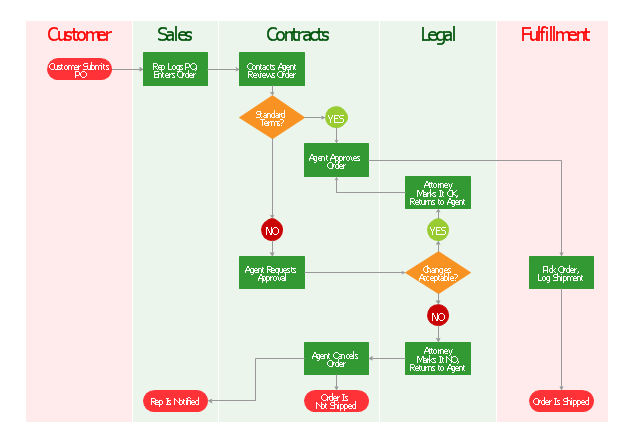
"Order processing is a key element of Order fulfillment. Order processing operations or facilities are commonly called "distribution centers". "Order processing" is the term generally used to describe the process or the work flow associated with the picking, packing and delivery of the packed item(s) to a shipping carrier. The specific "order fulfillment process" or the operational procedures of distribution centers are determined by many factors. Each distribution center has its own unique requirements or priorities." [Order processing. Wikipedia]
The vertical cross-functional flow chart example "Order processing" was created using the ConceptDraw PRO diagramming and vector drawing software extended with the Flowcharts solution from the area "What is a Diagram" of ConceptDraw Solution Park.
The vertical cross-functional flow chart example "Order processing" was created using the ConceptDraw PRO diagramming and vector drawing software extended with the Flowcharts solution from the area "What is a Diagram" of ConceptDraw Solution Park.
Cross-functional flowchart
Collaboration in a Project Team

- Pyramid Diagram | Priority pyramid diagram | Pyramid Chart ...
- How To Create a Prioritization Matrix | Prioritization matrix ...
- PROBLEM ANALYSIS. Prioritization Matrix | How To Create a ...
- Work Order Process Flowchart. Business Process Mapping Examples
- SWOT Matrix Template | SWOT Analysis Solution - Strategy Tools ...
- PROBLEM ANALYSIS. Prioritization Matrix | Matrix Organization ...
- Work Order Process Flowchart. Business Process Mapping ...
- TQM Diagram Example | Definition TQM Diagram | TQM Software ...
- Work Order Process Flowchart. Business Process Mapping Examples
- Order processing - Cross-functional flowchart | Order processing ...
- Website Design Flowchart Example
- Starting a Drawing Project Has Never Been Easier | Process ...
- Export from ConceptDraw PRO Document to a Graphic File ...
- Flow chart Example . Warehouse Flowchart | Order processing ...
- Work Order Process Flowchart. Business Process Mapping Examples
- Basic Diagramming | Building Drawing Design Element: Shipping ...
- Material Requisition Flowchart. Flowchart Examples | Order ...
- Software workflow diagram | Workflow Diagram Software Mac ...
- Work Order Process Flowchart. Business Process Mapping Examples
- Sample Approval Flow