Entity Relationship Diagram Examples
Creation of Entity-Relationship (ER) model is a visual representation the structure of a business database, where data equates to entities or objects, which are linked by defined relationships expressing dependencies and requirements. By the nature, the ER model is an abstract visualization, a first step in design process towards creating a logical and functional database. ConceptDraw DIAGRAM professional software gives the ability to effectively describe a database using the Entity-Relationship model. Included to ConceptDraw Solution Park, the Entity-Relationship Diagram (ERD) solution contains the set of predesigned vector icons advocated by Chen's and Crow’s Foot notations that both can be used for data modeling and describing a database. Entity-Relationship Diagram (ERD) solution includes also helpful templates and incredibly large collection of varied Entity Relationship Diagram examples and samples offered at ConceptDraw STORE. Each of them can be used to develop your own model of a database of arbitrary complexity.
Entity Relationship Software
Entity Relationship Diagram (ERD) is a leading data modeling tool that is used to illustrate the logical structure of database, helps to organize and represent your project's data in terms of entities, attributes and relationships. To describe the database structure usually is used the ERD Chen's or Crow's Foot notation. Chen's notation supposes the representation of entities by rectangles with the entities names inside, relationships by diamonds and attributes by ovals connected with a line to exactly one entity. In Crow's Foot notation the boxes are used to depict the entities and their attributes, the lines between them - to depict relationships. ConceptDraw DIAGRAM software extended with Entity-Relationship Diagram (ERD) Solution is convenient and useful for designing the ER Diagrams, and supports the use of Chen's or Crow’s Foot notation according to your needs and desires. The ERD diagrams produced with ConceptDraw DIAGRAM Entity Relationship Diagram software can be successfully used in whitepapers, presentations, posters, datasheets, technical materials, etc.Developing Entity Relationship Diagrams
When you need to visually represent the structure of relational database, Entity relationship diagram (ERD) is a type of diagram for that case. Most entity-relationship diagrams can be built with objects from Flowchart solution or ERD Solution which contains inbuilt templates. Follow these steps to create your own custom ERD diagram. Don't be frightened if it looks complex, ConceptDraw DIAGRAM makes it easy to create an ERD, and hundreds of other diagrams, in minutes.What's the best ERD tool for the Mac?
What's the best ERD tool for the Mac? ConceptDraw DIAGRAM on Mac OS X supplied with Entity-Relationship Diagram (ERD) Solution from the Software Development Area for ConceptDraw Solution Park is the best ERD tool! This solution offers for ConceptDraw users so powerful drawing tools, libraries with numerous ERD objects, which will help design ER diagrams of any complexity and any design you want.Business Process Mapping — How to Map a Work Process
ConceptDraw DIAGRAM is a world-class diagramming platform that lets you display, communicate, and present dynamically. It′s powerful enough to draw everything from basic flowcharts to complex engineering schematics. Video tutorials on ConceptDraw products. Try it today!Entity Relationship Diagram Examples
ConceptDraw DIAGRAM diagramming and vector drawing software offers the Entity-Relationship Diagram (ERD) Solution from the Software Development Area for ConceptDraw Solution Park. How many examples contains the Entity-Relationship Diagram (ERD) Solution! All Entity Relationship Diagram examples were designed and saved for ConceptDraw DIAGRAM users. Now they are available from ConceptDraw STORE.The Sales Process
The Sales Process is a complex approach for selling a product or service which assumes many steps including the sales planning, realization of the sales marketing and management strategies, sales process analysis, etc. Now we have a ConceptDraw DIAGRAM software extended with unique Sales Flowcharts solution from the Marketing area of ConceptDraw Solution Park which ideally suits for the planning and realization the company's sales process.Educational Technology Tools
What are the favorite educational technology tools and techniques for teachers? Of course these are pictures, images and education infographics! ConceptDraw DIAGRAM software supplied with Education Infographics Solution from the Business Infographics Area provides powerful drawing tools to help design the education infographics of any complexity.Data Flow Diagrams
The information system manages the flow of data introduced into the system. To graphically represent and document the flow of data through some information system is used a Data Flow Diagram (DFD). DFD is a way to visualize the flow of data or data processing, to clearly demonstrate what type of data or information is transferred, where they come from and where are sent. It lets to create an overview of the system, to depict the major steps, and effectively model the processes. DFDs are helpful for analyzing and modifying the business systems. Traditionally are used two notations for DFDs creation - Yourdon-Coad and Gane-Sarson. ConceptDraw DIAGRAM software offers a special Data Flow Diagrams solution from Software Development area, which enables to quickly and simply create professional Data Flow Diagrams including the data storage, data flows, external entities, functional transforms, control transforms and signals. Use the offered templates, samples and extensive range of libraries to design your own Data Flow Diagrams in minutes.Business Process Modeling Software for Mac
ConceptDraw DIAGRAM - business process modeling software for mac offers the Business Process Diagram Solution with powerful tools to help you easy represent the business processes and create the business process diagrams based on BPMN 1.2 and BPMN 2.0 standards that allows to create of both simple and complex (nested) models of processes.Microsoft Azure
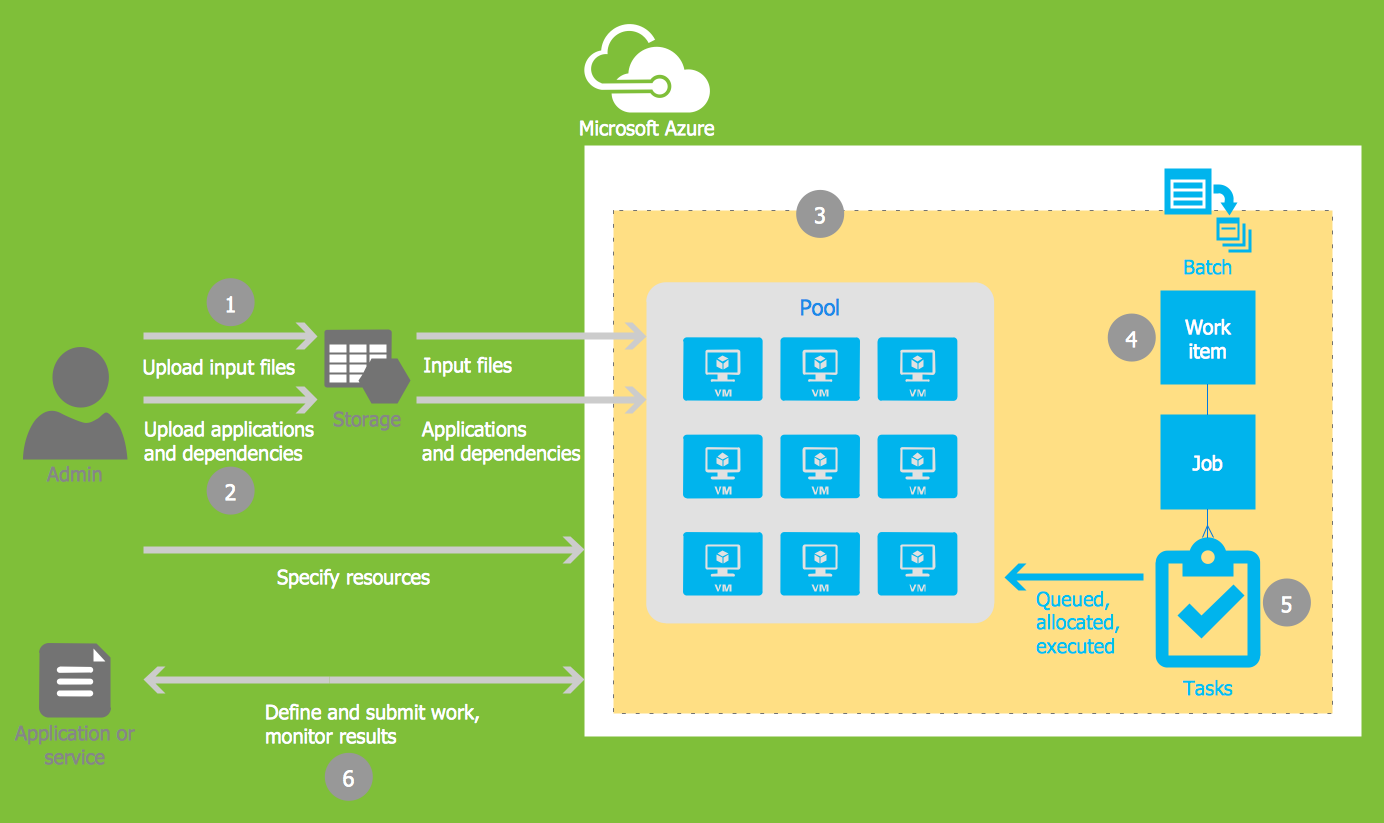
Microsoft Azure is widely used cloud platform which was created by Microsoft and now is managed by Microsoft datacenters in 19 regions of the world, and has a wide set of benefits and features. ConceptDraw DIAGRAM diagramming and vector drawing software extended with Azure Architecture Solution from the Computer and Networks area of ConceptDraw Solution Park is the best for designing various pictorial infographics, illustrations and materials showing the possibilities and work of Microsoft Azure Cloud System and Azure services.Wireframe Tools
A wireframe is a scheme of a future web page. Wireframe illustrates the web page structure, location and size of the main elements, as well as their interaction with the user. With such scheme designer defines the functionality of the page, not its appearance.Create Flow Chart on Mac
A Flowchart is a commonly used type of chart that describes an algorithm, process or workflow. It applies the boxes of various kinds to represent the steps and connects them with arrows showing their order. The Flowcharts help to understand the processes, visualize the process steps, and effectively find the flaws and bottlenecks. They are widely used in various fields for analyzing, documenting, designing, and managing simple and complex processes and programs, for representing process operations and problems' solution models. There are many types of Flowcharts, such as Cross-Functional Flowcharts, Data Flow Diagrams, Swimlane Flowcharts, Workflow Diagrams, Business Process Diagrams, Process Flowcharts, etc. ConceptDraw DIAGRAM is a powerful diagram software used to create Flow chart on Mac and Windows without efforts. The Flowcharts solution from Diagrams area of ConceptDraw Solution Park and ConceptDraw Rapid Draw functionality are greatly effective tools for designing various types of Flowcharts for business processes.SWOT matrix template
SWOT matrix templates is part of SWOT Analysis solution from ConceptDraw Solution Park.Marketing Analysis Diagram
An example of marketing analysis diagram, can be used to analyse product market and define marketing strategy. This types of charts used by small business project management for making presentations on market shares, it used by marketing project management software and project management tracking tools for reporting results and statuses.Six Markets Model Chart Template
This template shows the Six Markets Model Chart and was included in Marketing Diagrams Solution. It is available from ConceptDraw STORE and can be used as the base for creating your own marketing diagrams.Software for Drawing EPC Diagrams
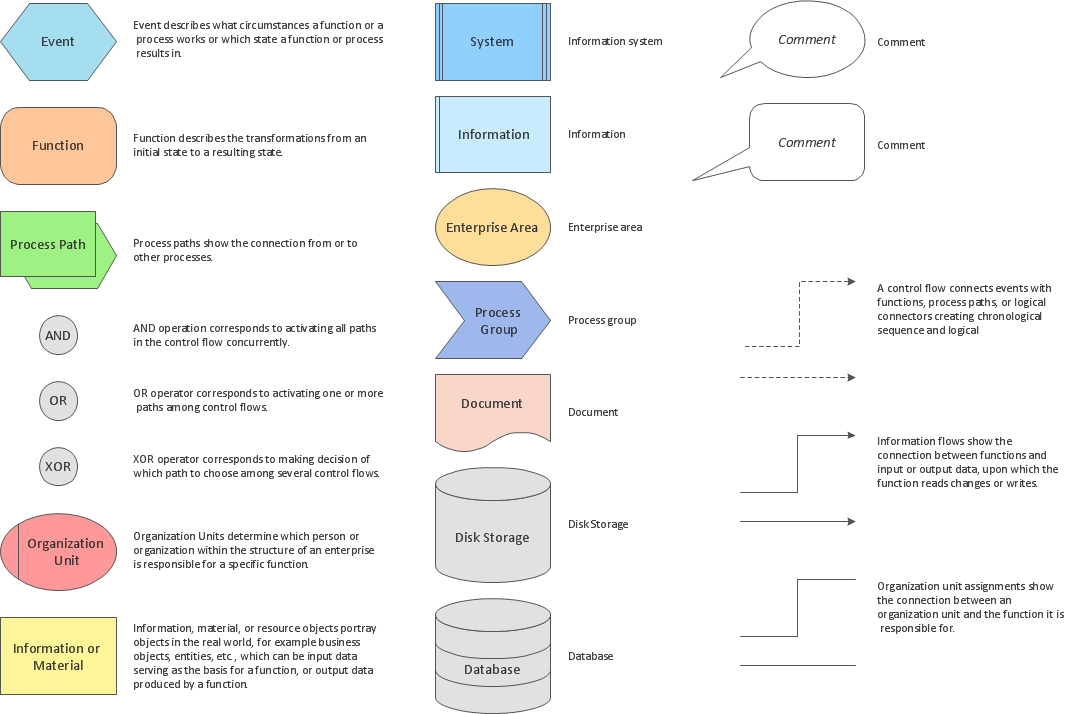
Event-Driven Process chain Diagrams for improvement throughout an organisation. ConceptDraw DIAGRAM - software that reduces the time needed to create a business process model.What is SWOT Analysis?
What is SWOT analysis? The SWOT abbreviation is formed from the reduction of four words - strength, weakness, opportunity and threat, on which is based the SWOT analysis. It is a structured planning method that involves the analysis of the situation within a company, as well as analysis of external factors and the situation on the market. SWOT analysis emphasizes that the strategy must to combine the internal capabilities and external situation the best way as possible. The use of SWOT analysis allows to systemize all available information and apply this clear picture to make informed decisions concerning to your business development. In fact, SWOT analysis is an intermediate step between the formulation of goals and the statement of problem. The main goal is a sustainability and improvement of efficiency of business functioning. When you have an installed ConceptDraw DIAGRAM software, it gives you a lot of benefits in SWOT analysis. Use the powerful drawing tools and capabilities of the SWOT and TOWS Matrix Diagrams solution to hold the SWOT analysis effectively and with pleasure.Network Diagram Software Topology Network
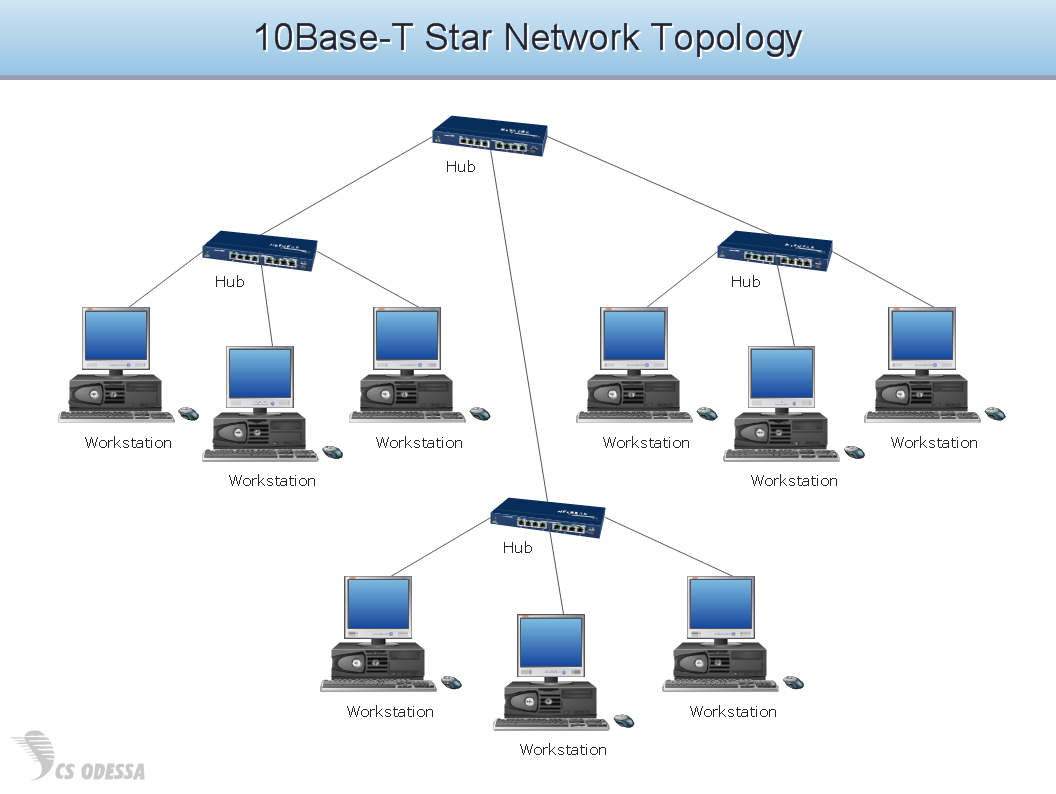
Draw Network Topology and Computer Network Diagrams, Designs, Schematics, and Network Maps using ConceptDraw in no Time!
- Entity Relationship Diagram Examples | Active Directory Diagrams ...
- Entity Relationship Diagram Examples
- Entity Relationship Diagram Examples
- Sign Making Software | Entity Relationship Diagram Examples ...
- Entity Relationship Diagram Examples | Active Directory Diagrams ...
- Entity Relationship Diagram Examples
- Entity Relationship Diagram Examples
- Entity Relationship Diagram Examples | Entity Relationship Software ...
- Active Directory Diagrams | AWS Architecture Diagrams | Entity ...
- Active Directory Diagrams | Entity Relationship Diagram Examples ...
- Sign Making Software | Entity Relationship Diagram Examples ...
- Sign Making Software | Entity Relationship Software | Quality Control ...
- Entity Relationship Diagram Examples | Entity Relationship Software ...
- Create Flow Chart on Mac | Entity Relationship Diagram Examples ...
- Entity Relationship Diagram Examples
- Sign Making Software | Active Directory Diagrams | AWS ...
- Entity Relationship Software | ConceptDraw PRO Compatibility with ...
- Network Topology Mapper | Entity Relationship Diagram Examples ...
- Sign Making Software | Entity Relationship Diagram Examples ...
- How to Draw an Effective Flowchart | Entity-Relationship Diagram ...


