Venn Diagram Examples for Problem Solving. Environmental Social Science. Human Sustainability Confluence

Basic Circles Venn Diagram. Venn Diagram Example

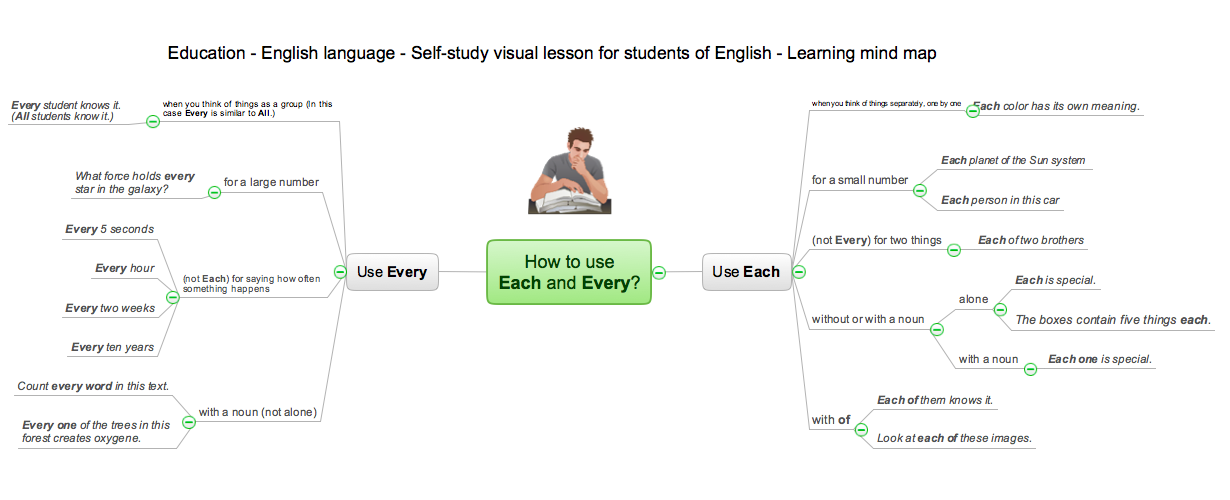
Language School E-Learning

This cycle diagram sample was created on the base of the figure illustrating the article "Environmental Materials" by Cris Arnold from the website of the UK Centre for Materials Education of the Higher Education Academy. "The figure ... schematically shows how the disparate areas under the heading of 'environmental materials' can be linked via a life cycle analysis approach. ...
Life Cycle Analysis.
Life Cycle Analysis is essentially a method of considering the entire environmental impact, energy and resource usage of a material or product. It is often known as a 'cradle-to-grave' analysis and can encompass the entire lifetime from extraction to end-of-life disposal. Life cycle analysis can be an extremely effective way of linking many different aspects of the environmental impacts of materials usage. ...
Materials Extraction and Resource Implications.
The environmental impact of raw materials extraction and processing together with global resource issues provides a good place to start consideration of environmental aspects of materials. ...
Environmental Impacts of Processing.
... Topics that would come under this subject area include the specific environmental problems associated with processing of metals, polymers, ceramics, composites etc, and how these problems can be overcome.
Design for Sustainability.
This area ... will ... cover issues such as design for successful recycling, waste minimisation, energy efficiency and increased lifetime.
Economic, Social and Legislative Issues.
... For example, materials selection within the automotive industry is now heavily influenced by 'end-of-life vehicle' and 'hazardous material' regulations.
Use of Sustainable Materials.
... It is probably sensible to define such materials as those that have distinct differences that achieve environmental benefit compared to conventional materials. With this definition, the list would include:
(1) Materials of a significantly plant-based nature, including wood, natural fibre composites, natural polymers.
(2) Materials produced using a large proportion of waste material, including recycled polymers, composites made from waste mineral powders, and arguably also much steel and aluminium.
Materials for Green Energy.
The most exciting developments in Materials Science are in the realm of functional materials, and many of these serve an environmentally-beneficial purpose, particularly in the production of green energy.
These include:
(1) Solar-cell materials.
(2) Fuel-cell technology.
(3) Catalytic pollution control.
End-of-Life Issues.
The treatment of materials at the end of their lifetime is a significant subject area and encompasses aspects such as recycling techniques and materials limitations, biodegradabilty and composting, chemical recovery and energy recovery." [materials.ac.uk/ guides/ environmental.asp]
The ring chart example "Life cycle analysis" was created using the ConceptDraw PRO diagramming and vector drawing software extended with the Target and Circular Diagrams solution from the Marketing area of ConceptDraw Solution Park.
www.conceptdraw.com/ solution-park/ marketing-target-and-circular-diagrams
Ring chart

Pyramid Diagram

Fishbone Problem Solving

Venn Diagram Template for Word

Basic Audit Flowchart. Flowchart Examples

Business process Flow Chart — Event-Driven Process chain (EPC) diagrams

Simple Drawing Applications for Mac

This Venn diagram sample depicts the path to sustainable development.
"Sustainable development is an organizing principle for human life on a finite planet. It posits a desirable future state for human societies in which living conditions and resource-use meet human needs without undermining the sustainability of natural systems and the environment, so that future generations may also have their needs met.
Sustainable development ties together concern for the carrying capacity of natural systems with the social and economic challenges faced by humanity. As early as the 1970s, 'sustainability' was employed to describe an economy "in equilibrium with basic ecological support systems." Scientists in many fields have highlighted The Limits to Growth, and economists have presented alternatives, for example a 'steady state economy', to address concerns over the impacts of expanding human development on the planet." [Sustainable development. Wikipedia]
The Venn diagram example "Path to sustainable development" was created using the ConceptDraw PRO diagramming and vector drawing software extended with the Venn Diagrams solution from the area "What is a Diagram" of ConceptDraw Solution Park.
Venn diagram

Venn Diagram Examples for Problem Solving

Using Fishbone Diagrams for Problem Solving

SWOT Analysis

Competitor Analysis

- Venn Diagram Examples for Problem Solving. Environmental Social ...
- Venn Diagram Examples for Problem Solving. Environmental Social ...
- Diagrams Of Sustainability Of The Environment
- Pie Chart Of Environment And Sustainable Development
- Sustainability Bubble Diagram Social Economy Environment
- Venn Diagram Examples for Problem Solving. Environmental Social ...
- Sustainable Environment Diagrams
- Path to sustainable development | Venn Diagram Examples for ...
- Venn Diagram Examples for Problem Solving. Environmental Social ...
- Basic Audit Flowchart. Flowchart Examples | Venn Diagram ...
- Path to sustainable development | Venn Diagrams | Venn Diagram ...
- How To Make Flow Chart For Threats To Environmental Sustainability
- Sustainable development | Path to sustainable development | Venn ...
- Relation In Venn Diagram Sustainable Development
- Path to sustainable development | Sustainable development | Venn ...
- Relationship marketing | Venn Diagram Examples for Problem ...
- Venn diagram - Path to sustainable development | Sustainable ...
- Social determinants of health | Venn Diagram Examples for Problem ...
- Basic Flowchart Symbols and Meaning | Venn Diagram Examples ...
- Human Resource Development | Path to sustainable development ...