Venn Diagram Examples for Problem Solving. Environmental Social Science. Human Sustainability Confluence

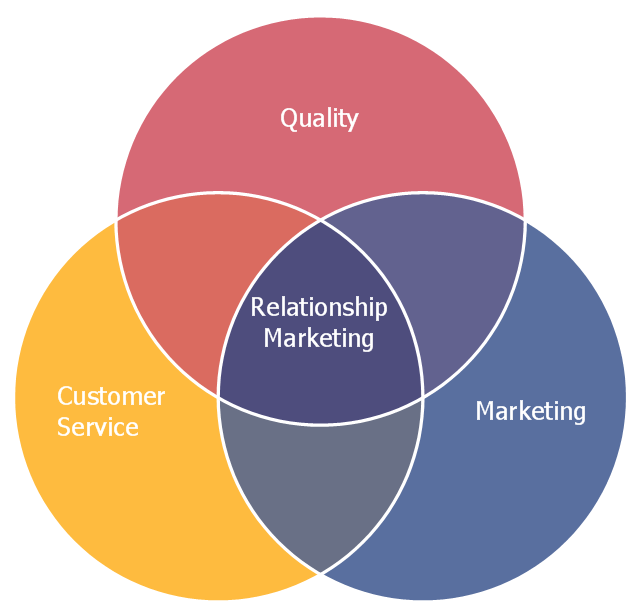
This Venn diagram sample depicts the relationship marketing.
"Relationship marketing was first defined as a form of marketing developed from direct response marketing campaigns which emphasizes customer retention and satisfaction, rather than a dominant focus on sales transactions. As a practice, relationship marketing differs from other forms of marketing in that it recognizes the long term value of customer relationships and extends communication beyond intrusive advertising and sales promotional messages. With the growth of the internet and mobile platforms, relationship marketing has continued to evolve and move forward as technology opens more collaborative and social communication channels. This includes tools for managing relationships with customers that goes beyond simple demographic and customer service data. Relationship marketing extends to include inbound marketing efforts, (a combination of search optimization and strategic content), PR, social media and application development." [Relationship marketing. Wikipedia]
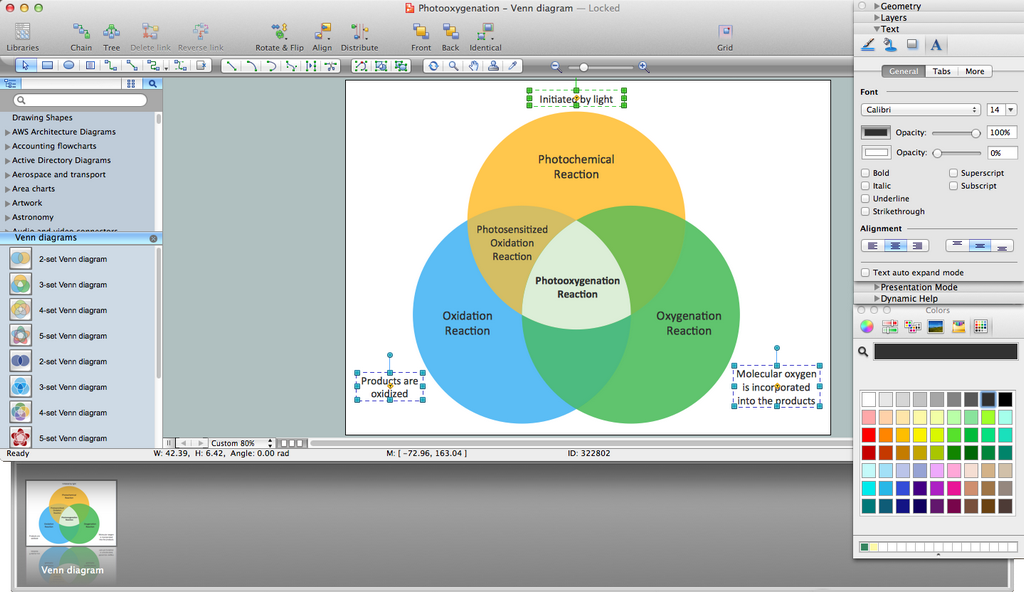
The Venn diagram example "Relationship marketing" was created using the ConceptDraw PRO diagramming and vector drawing software extended with the Basic Venn Diagrams solution from the area "What is a Diagram" of ConceptDraw Solution Park.
"Relationship marketing was first defined as a form of marketing developed from direct response marketing campaigns which emphasizes customer retention and satisfaction, rather than a dominant focus on sales transactions. As a practice, relationship marketing differs from other forms of marketing in that it recognizes the long term value of customer relationships and extends communication beyond intrusive advertising and sales promotional messages. With the growth of the internet and mobile platforms, relationship marketing has continued to evolve and move forward as technology opens more collaborative and social communication channels. This includes tools for managing relationships with customers that goes beyond simple demographic and customer service data. Relationship marketing extends to include inbound marketing efforts, (a combination of search optimization and strategic content), PR, social media and application development." [Relationship marketing. Wikipedia]
The Venn diagram example "Relationship marketing" was created using the ConceptDraw PRO diagramming and vector drawing software extended with the Basic Venn Diagrams solution from the area "What is a Diagram" of ConceptDraw Solution Park.
Venn diagram
Venn Diagram Template for Word

Basic Circles Venn Diagram. Venn Diagram Example

Management Tools — Total Quality Management

Venn Diagram Examples for Problem Solving

Venn Diagram Maker
Venn Diagram

 Venn Diagrams
Venn Diagrams are actively used to illustrate simple set relationships in set theory and probability theory, logic and statistics, mathematics and computer science, linguistics, sociology, and marketing. Venn Diagrams are also often used to visually summarize the status and future viability of a project.
Circles Venn Diagram

 Entity-Relationship Diagram (ERD)
An Entity-Relationship Diagram (ERD) is a visual presentation of entities and relationships. That type of diagrams is often used in the semi-structured or unstructured data in databases and information systems. At first glance ERD is similar to a flowch
Entity-Relationship Diagram (ERD) with ConceptDraw DIAGRAM


 Entity-Relationship Diagram (ERD)
Entity-Relationship Diagram (ERD) solution extends ConceptDraw DIAGRAM software with templates, samples and libraries of vector stencils from drawing the ER-diagrams by Chen's and crow’s foot notations.
Business process Flow Chart — Event-Driven Process chain (EPC) diagrams

Pyramid Diagram

- Venn Diagram Examples for Problem Solving. Environmental Social ...
- Venn Diagram Examples for Problem Solving. Environmental Social ...
- Relationship marketing | Venn diagram - Relationship marketing ...
- Venn Diagram Examples for Problem Solving. Environmental Social ...
- Relationship marketing | Six Markets Model Chart | Venn Diagram ...
- Venn Diagram Examples for Problem Solving. Environmental Social ...
- Venn Diagram About Apllied Science And Social Science
- Venn Diagram Examples for Problem Solving. Environmental Social ...
- Entity Relationship Diagram Symbols | Venn Diagram Examples for ...
- Diagramming Social Relationships
- Venn Diagram Examples for Problem Solving. Environmental Social ...
- Venn Diagram Examples for Problem Solving. Environmental Social ...
- Fishbone Diagram Problem Solving | Venn Diagram Examples for ...
- Venn Diagram Examples for Problem Solving. Environmental Social ...
- Internet marketing professions | Basic Venn diagram - Internet ...
- Example Of Venn Diagram In Media
- Venn Diagrams | Venn Diagram Examples for Problem Solving ...
- UML Use Case Diagram Example Social Networking Sites Project ...
- Venn Diagram Examples for Problem Solving. Environmental Social ...