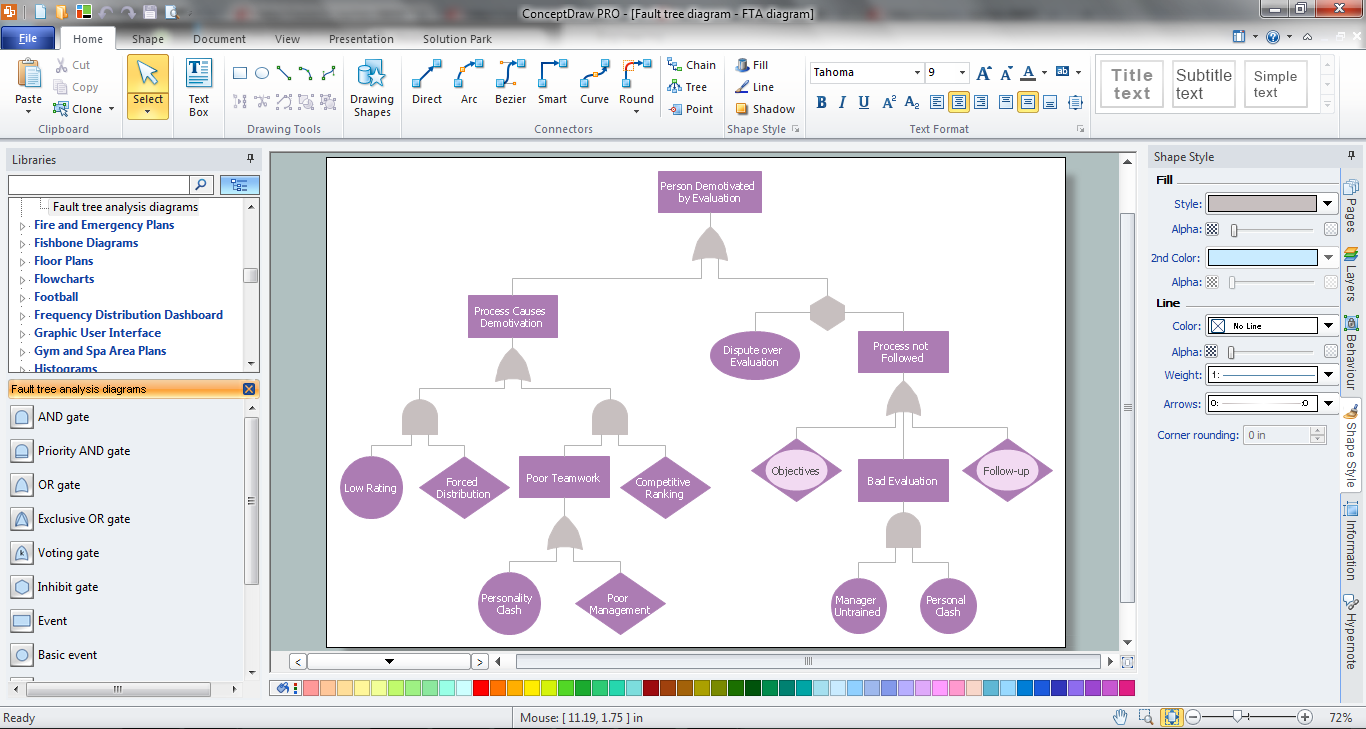
Fault Tree Analysis Software
Relationships Analysis


Cause and Effect Analysis

 Seven Management and Planning Tools
Seven Management and Planning Tools solution extends ConceptDraw DIAGRAM and ConceptDraw MINDMAP with features, templates, samples and libraries of vector stencils for drawing management mind maps and diagrams.
"A root cause is an initiating cause of a causal chain which leads to an outcome or effect of interest. Commonly, root cause is used to describe the depth in the causal chain where an intervention could reasonably be implemented to change performance and prevent an undesirable outcome." [Root cause. Wikipedia]
"Problem-solving consists of using generic or ad hoc methods, in an orderly manner, for finding solutions to problems. Some of the problem-solving techniques developed and used in artificial intelligence, computer science, engineering, mathematics, medicine, etc. are related to mental problem-solving techniques studied in psychology." [Problem solving. Wikipedia]
This root cause analysis (RCA) tree diagram example "Personal problem solution" was created using the ConceptDraw PRO diagramming and vector drawing software extended with the Seven Management and Planning Tools solution from the Management area of ConceptDraw Solution Park.
Tree diagram

HelpDesk
How To Create Root Cause Analysis Diagram Using Solutions

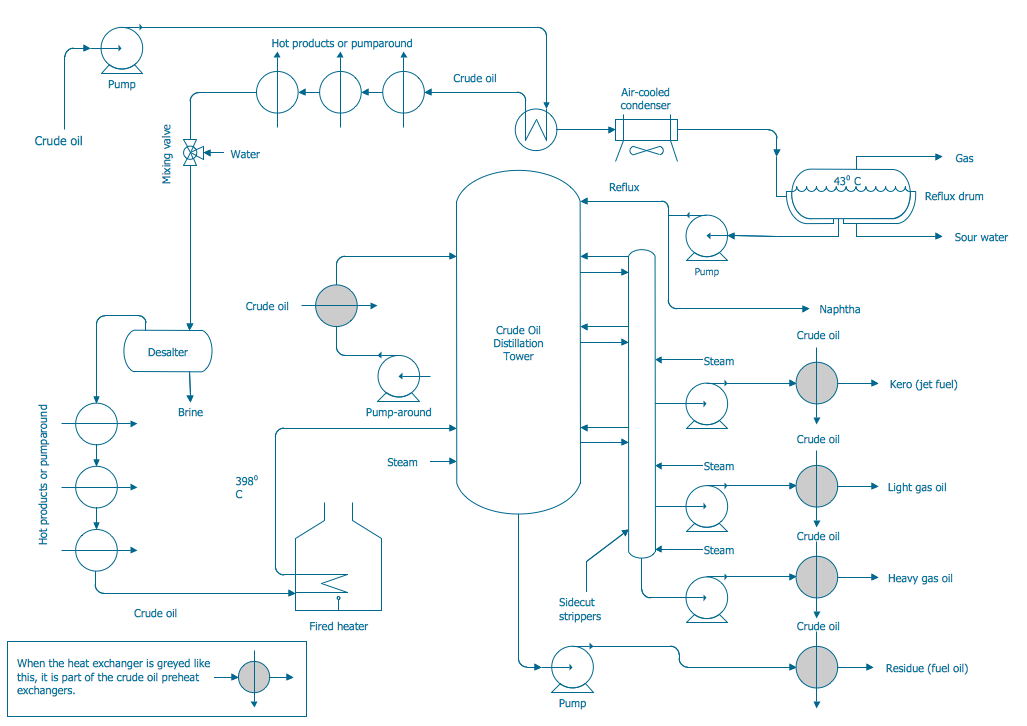
Process and Instrumentation Diagram
The Action Plan

Affinity Diagram

Prioritization Matrix

 Seven Management and Planning Tools
Seven Management and Planning Tools solution extends ConceptDraw DIAGRAM and ConceptDraw MINDMAP with features, templates, samples and libraries of vector stencils for drawing management mind maps and diagrams.
Property Management Examples

Cause and Effect Analysis - Fishbone Diagrams for Problem Solving

Workflow Diagram

"Root cause analysis (RCA) is a method of problem solving that tries to identify the root causes of faults or problems.
RCA practice tries to solve problems by attempting to identify and correct the root causes of events, as opposed to simply addressing their symptoms. Focusing correction on root causes has the goal of preventing problem recurrence. RCFA (Root Cause Failure Analysis) recognizes that complete prevention of recurrence by one corrective action is not always possible.
Conversely, there may be several effective measures (methods) that address the root causes of a problem. Thus, RCA is an iterative process and a tool of continuous improvement.
RCA is typically used as a reactive method of identifying event(s) causes, revealing problems and solving them. Analysis is done after an event has occurred. Insights in RCA may make it useful as a preemptive method. In that event, RCA can be used to forecast or predict probable events even before they occur. While one follows the other, RCA is a completely separate process to Incident Management." [Root cause analysis. Wikipedia]
The root cause analysis (RCA) tree diagram example "Manufacturing problem solution" was created using the ConceptDraw PRO diagramming and vector drawing software extended with the solution "Seven Management and Planning Tools" from the Management area of ConceptDraw Solution Park.
Tree diagram

- Fault Tree Analysis Diagrams | PROBLEM ANALYSIS . Root Cause ...
- Root cause analysis tree diagram - Template | Fault Tree Analysis ...
- Cause and Effect Analysis | PROBLEM ANALYSIS . Root Cause ...
- Process Flowchart | PROBLEM ANALYSIS. Root Cause Analysis ...
- Fault Tree Diagram | How To Create Root Cause Analysis Diagram ...
- PROBLEM ANALYSIS. Root Cause Analysis Tree Diagram ...
- Fault Tree Analysis Software | PROBLEM ANALYSIS . Root Cause ...
- Context Diagram Template | PROBLEM ANALYSIS . Root Cause ...
- Root cause analysis tree diagram - Template | PROBLEM ...
- Root cause analysis tree diagram - Sale problem solution ...
- Factor Tree Analysis Example
- Fault Tree Analysis Diagrams | Context Diagram Template | Root ...
- Cause and Effect Analysis | PROBLEM ANALYSIS . Root Cause ...
- Cause and Effect Analysis | Root Cause Analysis | PROBLEM ...
- Root cause analysis tree diagram - Template | New Year card Santa ...
- PROBLEM ANALYSIS. Root Cause Analysis Tree Diagram | Fault ...
- Root cause analysis tree diagram - Personal problem solution ...
- PROBLEM ANALYSIS. Root Cause Analysis Tree Diagram
- Root cause analysis tree diagram - Manufacturing problem solution
- Root cause analysis tree diagram - Personal problem solution ...