Fault Tree Analysis Software
 Fault Tree Analysis Diagrams
This solution extends ConceptDraw DIAGRAM.5 or later with templates, fault tree analysis example, samples and a library of vector design elements for drawing FTA diagrams (or negative analytical trees), cause and effect diagrams and fault tree diagrams.
Tree Network Topology Diagram

Network Topologies


Relationships Analysis


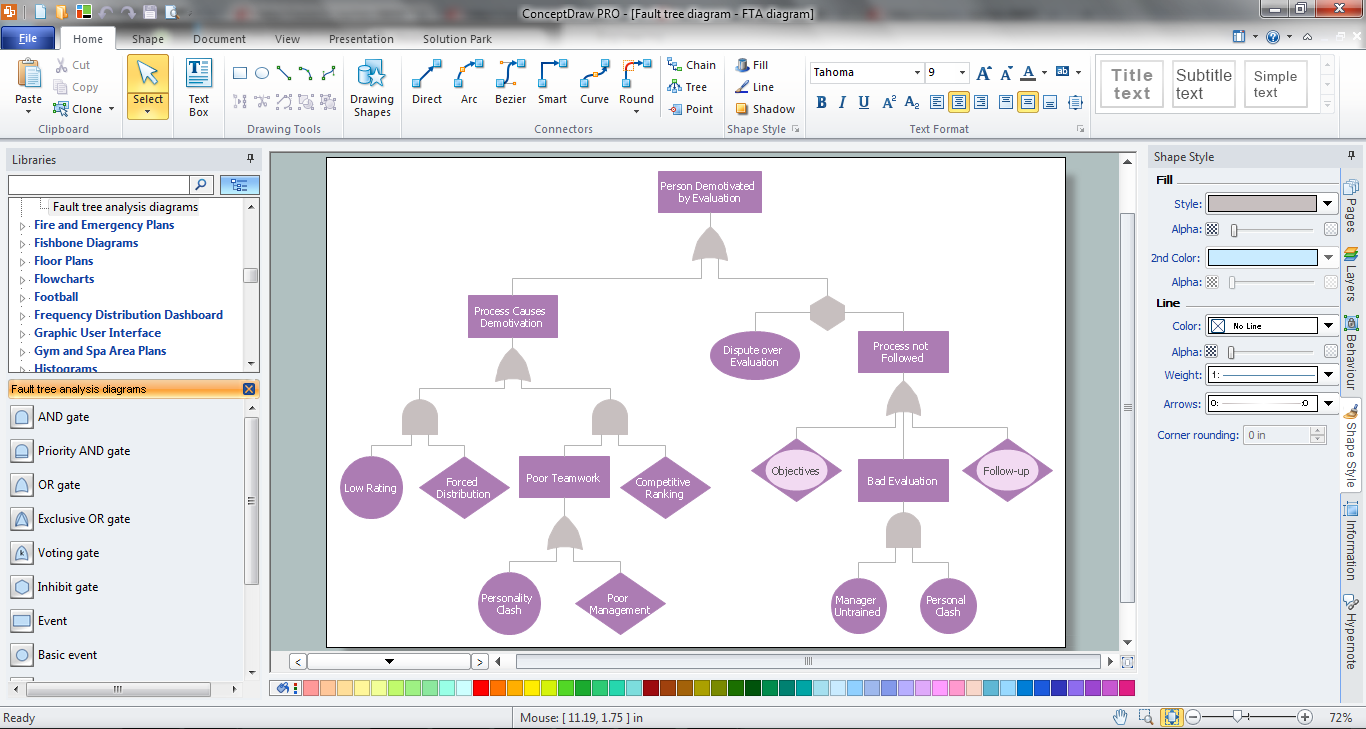
The vector stencils library "Fault tree analysis diagrams" contains 12 symbols for drawing Fault Tree Analysis (FTA) diagrams.
"Fault tree analysis (FTA) is a top down, deductive failure analysis in which an undesired state of a system is analyzed using Boolean logic to combine a series of lower-level events. This analysis method is mainly used in the fields of safety engineering and reliability engineering to understand how systems can fail, to identify the best ways to reduce risk or to determine (or get a feeling for) event rates of a safety accident or a particular system level (functional) failure. FTA is used in the aerospace, nuclear power, chemical and process, pharmaceutical, petrochemical and other high-hazard industries; but is also used in fields as diverse as risk factor identification relating to social service system failure.
In aerospace, the more general term "system Failure Condition" is used for the "undesired state" / Top event of the fault tree. These conditions are classified by the severity of their effects. The most severe conditions require the most extensive fault tree analysis. These "system Failure Conditions" and their classification are often previously determined in the functional Hazard analysis." [Fault tree analysis. Wikipedia]
The shapes example "Fault tree analysis diagrams" was created using the ConceptDraw PRO diagramming and vector drawing software extended with the Fault Tree Analysis Diagrams solution from the Engineering area of ConceptDraw Solution Park.
FTA diagram symbols

Chemical Engineering

Affinity Diagram

HelpDesk
How To Create Root Cause Analysis Diagram Using Solutions

Context Diagram Template

This template shows the Context Diagram. It was created in ConceptDraw DIAGRAM diagramming and vector drawing software using the Block Diagrams Solution from the “Diagrams” area of ConceptDraw Solution Park. The context diagram graphically identifies the system. external factors, and relations between them. It’s a high level view of the system. The context diagrams are widely used in software engineering and systems engineering for designing the systems that process the information.
TQM Diagram Tool

 Office Layout Plans
Office layouts and office plans are a special category of building plans and are often an obligatory requirement for precise and correct construction, design and exploitation office premises and business buildings. Designers and architects strive to make office plans and office floor plans simple and accurate, but at the same time unique, elegant, creative, and even extraordinary to easily increase the effectiveness of the work while attracting a large number of clients.
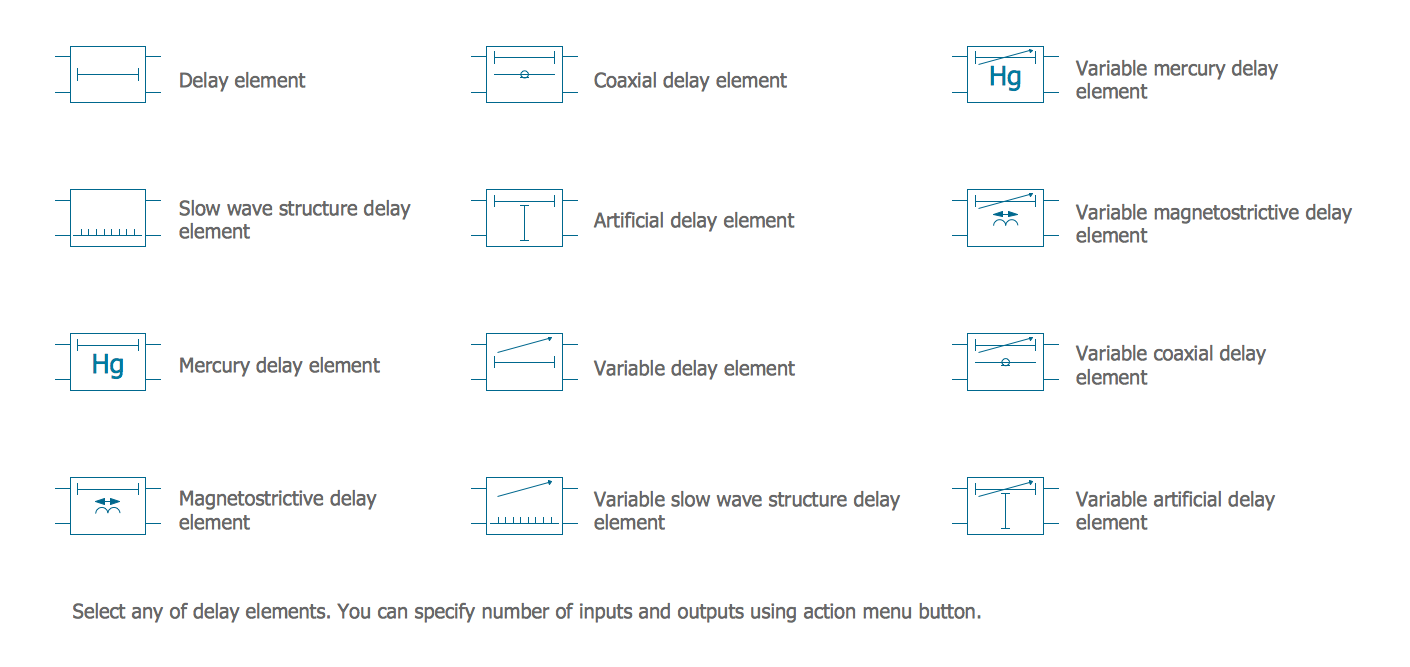
Electrical Symbols — Delay Elements
 Venn Diagrams
Venn Diagrams are actively used to illustrate simple set relationships in set theory and probability theory, logic and statistics, mathematics and computer science, linguistics, sociology, and marketing. Venn Diagrams are also often used to visually summarize the status and future viability of a project.
- Fta Factor Tree Analysis
- PROBLEM ANALYSIS. Root Cause Analysis Tree Diagram | How To ...
- Root cause analysis tree diagram - Template | PROBLEM ...
- Root cause analysis tree diagram - Template | Fault Tree Diagram ...
- Design elements - Fault tree analysis diagrams | FTA diagram ...
- Fault tree analysis - Insulin delivery system | Design elements - Fault ...
- PROBLEM ANALYSIS. Root Cause Analysis Tree Diagram
- Tree Diagram For Factors Of Production
- Fault Tree Analysis Diagrams
- PROBLEM ANALYSIS. Root Cause Analysis Tree Diagram ...
- PROBLEM ANALYSIS. Root Cause Analysis Tree Diagram | Cause ...
- Engineering Diagram With Respect To Simple Tree Diagram
- Best Software For Tree Diagram
- PROBLEM ANALYSIS. Root Cause Analysis Tree Diagram | Fault ...
- Entity Relationship Diagram Symbols | PROBLEM ANALYSIS. Root ...
- Person demotivated by evaluation - Fault tree analysis diagram ...
- Fault Tree Analysis Software | Fault Tree Analysis Diagrams | Fault ...
- PROBLEM ANALYSIS. Root Cause Analysis Tree Diagram | How to ...
- PROBLEM ANALYSIS. Root Cause Analysis Tree Diagram | Cause ...
- Cause Effect Tree Diagram