UML Notation

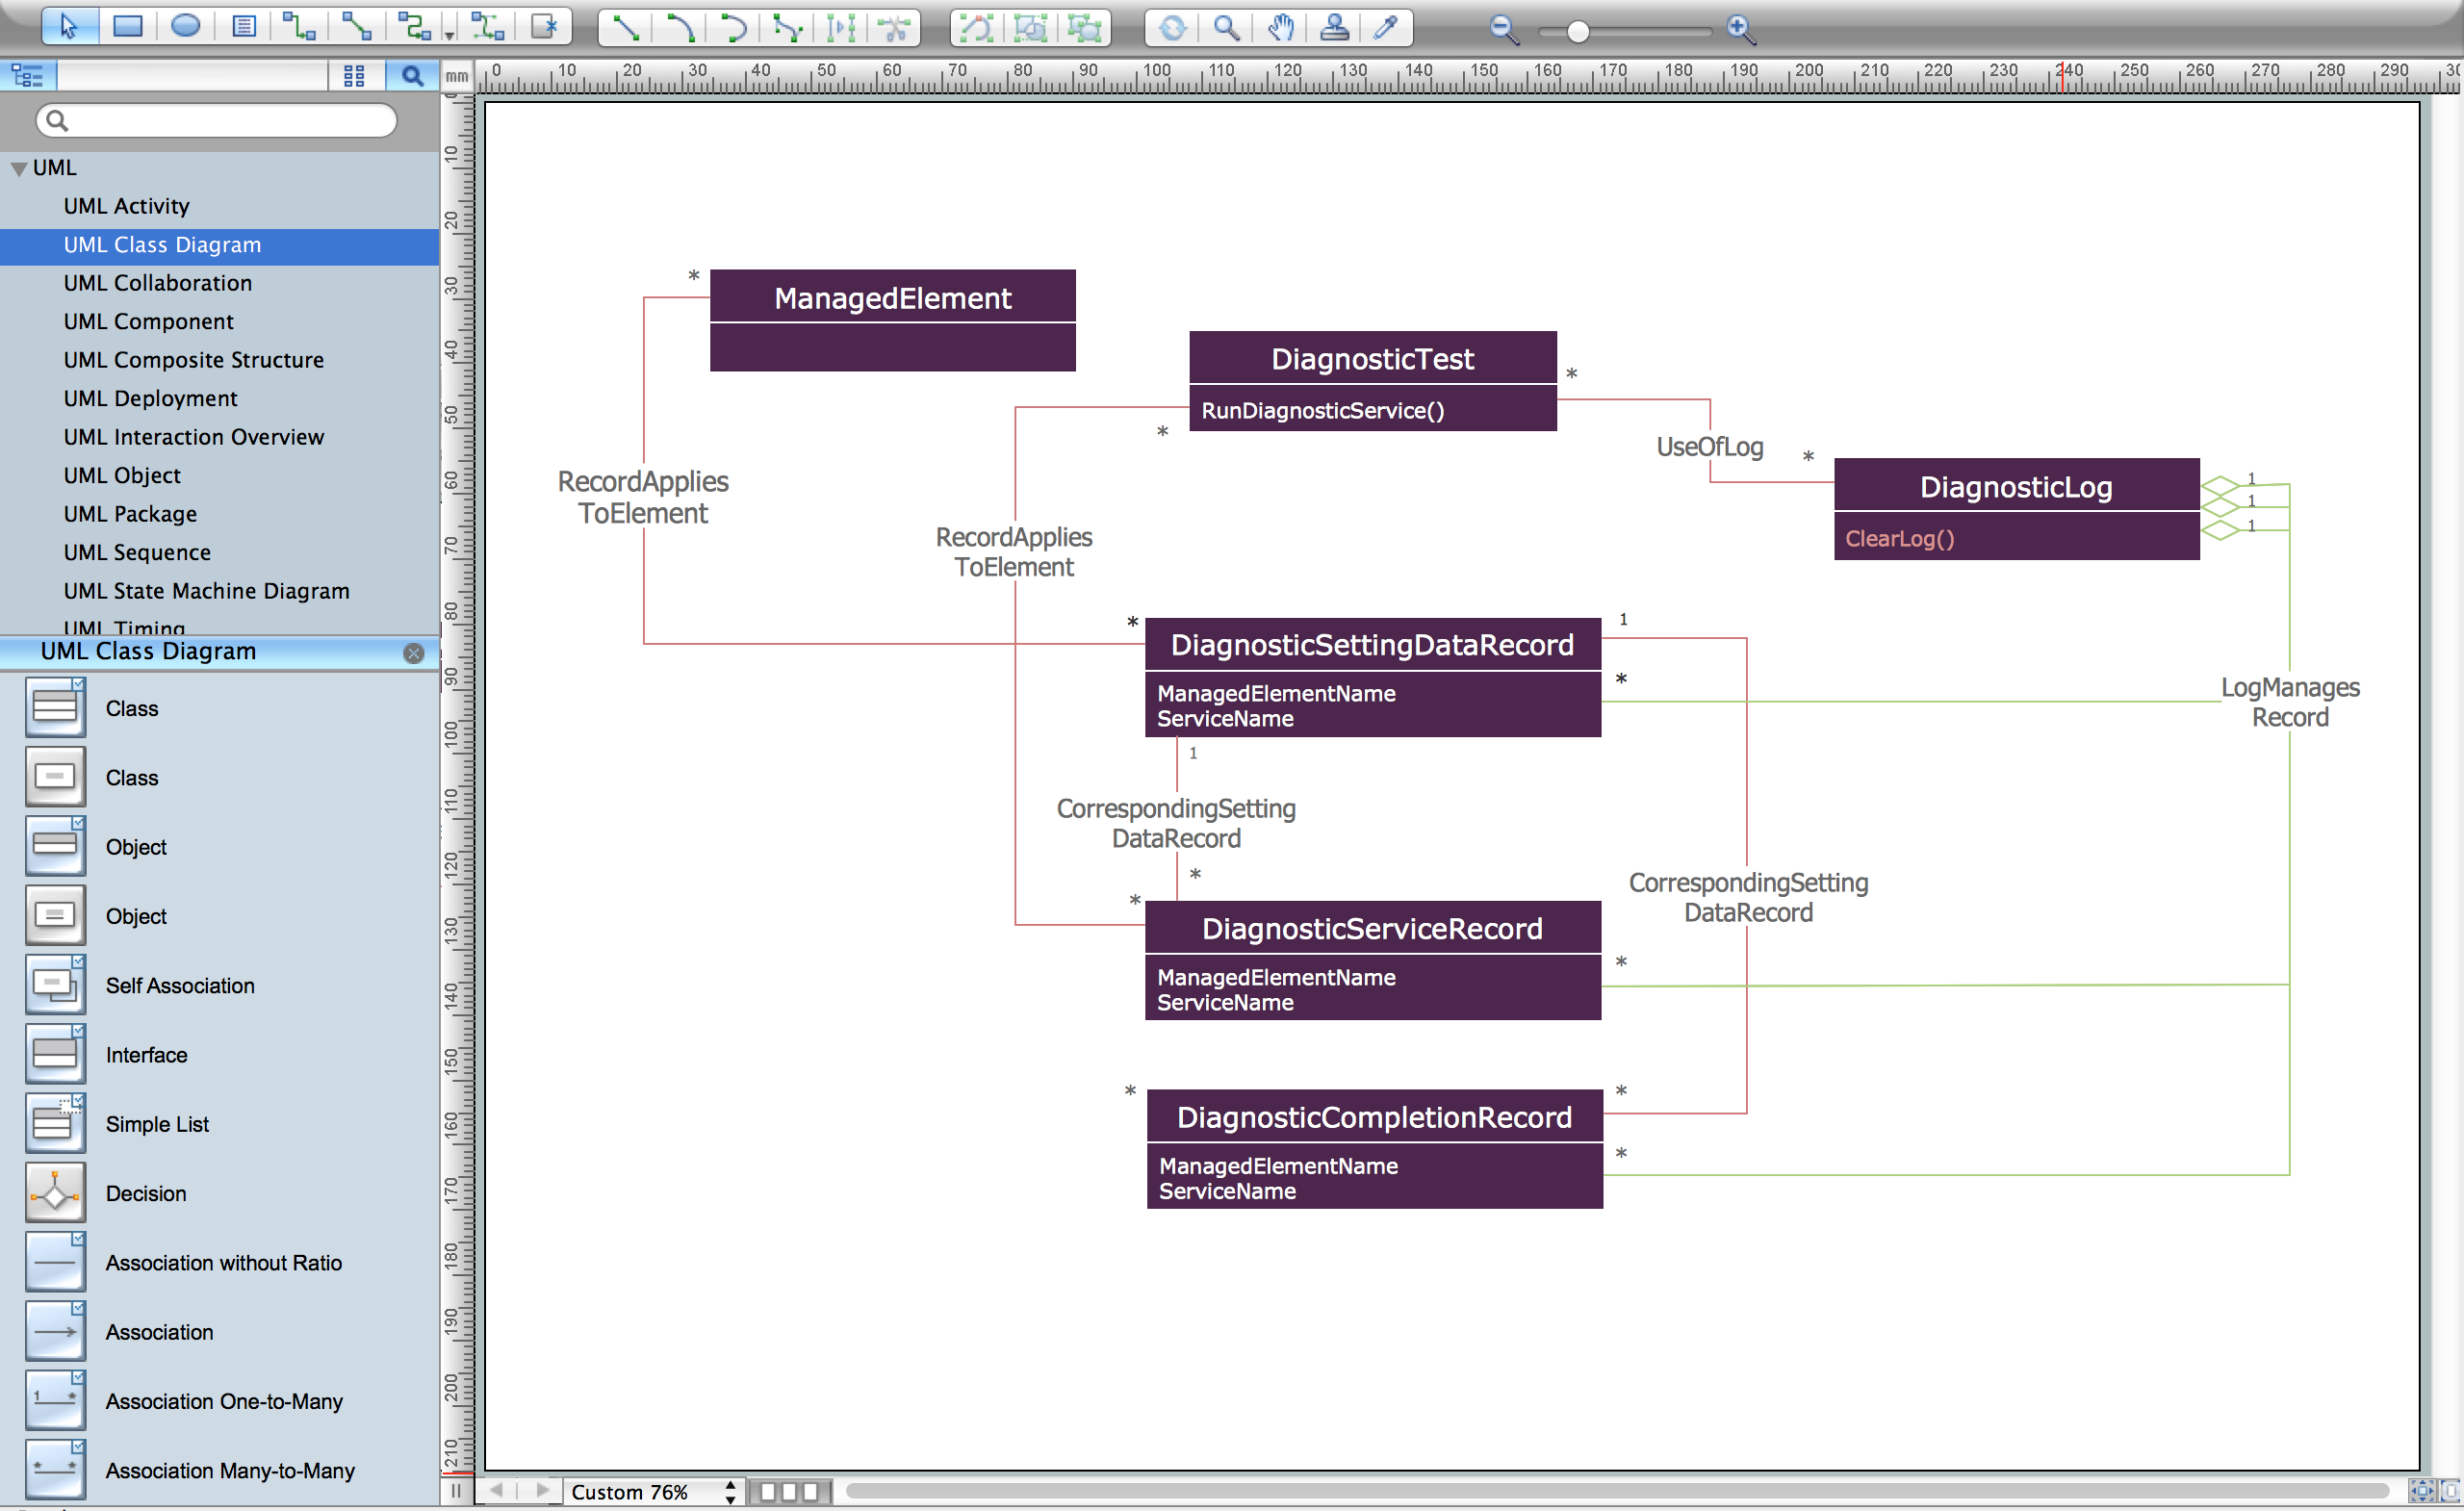
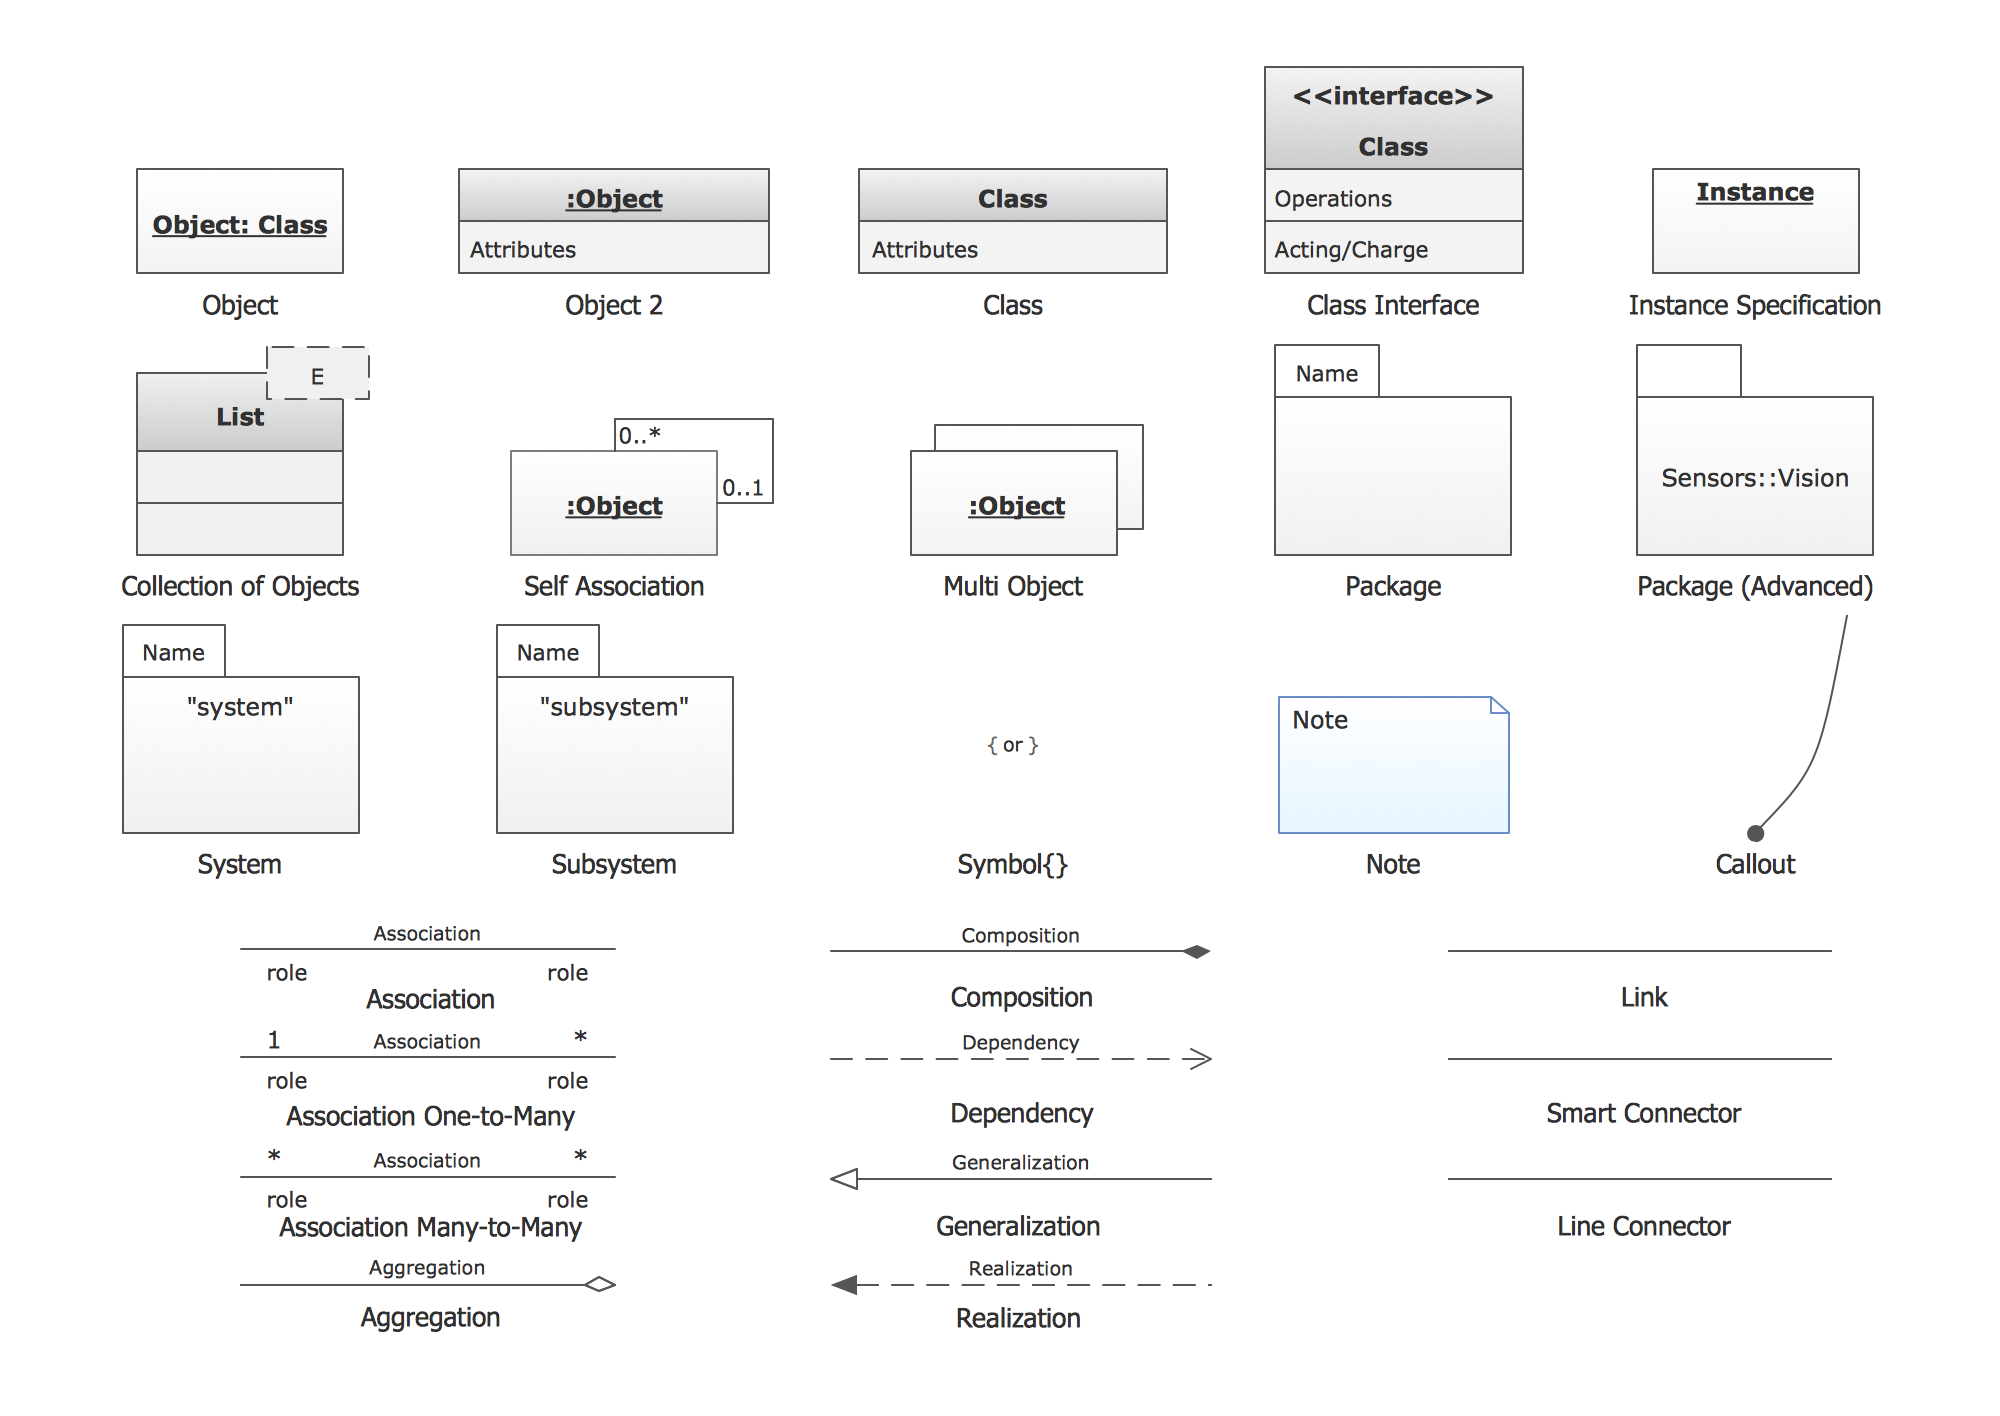
UML Class Diagram. Design Elements

UML Class Diagram Constructor
Use Case Diagrams technology with ConceptDraw DIAGRAM

UML Class Diagram Generalization Example UML Diagrams

Multi Layer Venn Diagram. Venn Diagram Example

SWOT Analysis Solution - Strategy Tools

UML Object Diagram. Design Elements
Venn Diagram Examples for Problem Solving. Venn Diagram as a Truth Table

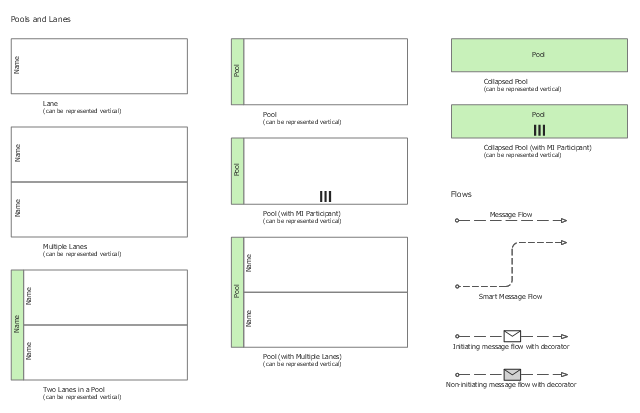
The vector stencils library "Swimlanes" contains 20 swimlane shapes for drawing business process diagrams (BPMN 2.0) using the ConceptDraw PRO diagramming and vector drawing software.
"Swim lanes are a visual mechanism of organising and categorising activities, based on cross functional flowcharting, and in BPMN consist of two types: (1) Pool. Represents major participants in a process, typically separating different organisations. A pool contains one or more lanes (like a real swimming pool). A pool can be open (i.e., showing internal detail) when it is depicted as a large rectangle showing one or more lanes, or collapsed (i.e., hiding internal detail) when it is depicted as an empty rectangle stretching the width or height of the diagram. (2) Lane. Used to organise and categorise activities within a pool according to function or role, and depicted as a rectangle stretching the width or height of the pool. A lane contains the flow objects, connecting objects and artifacts." [Business Process Model and Notation. Wikipedia]
The example "Design elements - Swimlanes BPMN 2.0" is included in the Business Process Diagram solution from the Business Processes area of ConceptDraw Solution Park.
BPMN 2.0 swimlanes
HelpDesk
How to Create a CCTV Diagram

Pie Chart Software

IDEF4 Standard

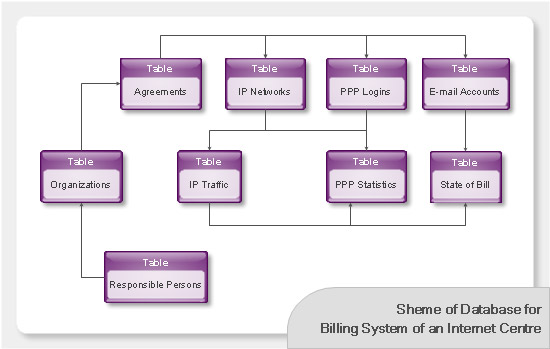
Databases Access Objects Model with ConceptDraw DIAGRAM
- Laboratory equipment - Vector stencils library | Diagram Of ...
- Laboratory equipment - Vector stencils library | Diagram Of Suction ...
- Laboratory equipment - Vector stencils library | Diagram Of ...
- Diagram Of Condenser Used In Chemical Laboratory
- Laboratory equipment - Vector stencils library | Diagram Of A Beaker ...
- Laboratory equipment - Vector stencils library | Diagram Of ...
- Diagram Of Glassware In Chemistry
- Diagram Of Laboratory Equipments And Their Uses
- Scientific Diagram Of Lab Equipment
- Draw Diagram Of Glass Ware Apparatus Equipment
- Diagram Of A Lab Funnel
- Laboratory equipment - Vector stencils library | Diagram Of ...
- Design elements - Swimlanes BPMN 2.0 | Business Process ...
- Laboratory equipment - Vector stencils library | Chemistry Symbols ...
- Blank Scatter Plot | Scatter Chart Examples | Scatter Plot | Scatter Plot
- Diagram Draw Marketing And Selling
- Diagrams Of Laboratory Equipments
- Societal Marketing Concept Diagram
- 4 Ms fishbone diagram - Production process | MS Windows Vista ...
- Laboratory equipment - Vector stencils library | Chemistry Symbols ...