Education Information

Information Graphic

HelpDesk
How to Create Education Infographics

Educational Materials

ConceptDraw PRO diagramming and vector drawing software offers the Education Infographics Solution from the Business Infographics Area to help each education-related person create professional looking and attractive educational materials.
 ConceptDraw Solution Park
ConceptDraw Solution Park collects graphic extensions, examples and learning materials
Educational Technology Tools

Education Infographics

Exercise your brain

The vector stencils library "Education maps" contains 44 map contours: the Group of Twenty (G20) state maps, EU state maps and world map.
Use it to visualize geospatial information on thematic maps in your education infograms.
"A world map is a map of most or all of the surface of the Earth. ...
A thematic map shows geographic information about one or a few focused subjects." [World map. Wikipedia]
The political World map example "Design elements - Education maps (World map)" was created using the ConceptDraw PRO diagramming and vector drawing software extended with the Education Infographics solition from the area "Business Infographics" in ConceptDraw Solution Park.
World map
.png--diagram-flowchart-example.png)
The vector stencils library "Education maps" contains 44 state map contours with capitals and major cities: G-20 state maps, EU state maps and world map.
Use it to visualize geospatial information in your education infograms.
"The European Union (EU) is a politico-economic union of 28 member states that are primarily located in Europe: Austria, Belgium, Bulgaria, Croatia, Cyprus, Czech Republic, Denmark, Estonia, Finland, France, Germany, Greece, Hungary, Ireland, Italy, Latvia, Lithuania, Luxembourg, Malta, Netherlands, Poland, Portugal, Romania, Slovakia, Slovenia, Spain, Sweden, United Kingdom." [European Union. Wikipedia]
The European Union map contours example "Design elements - Education maps (EU)" was created using the ConceptDraw PRO diagramming and vector drawing software extended with the Education Infographics solition from the area "Business Infographics" in ConceptDraw Solution Park.
European Union state map contours
.png--diagram-flowchart-example.png)
How to Make an Infographic

Make an Infographic

The vector stencils library "Education charts" contains 12 graphs and charts: area chart, column chart, divided bar diagram, histogram, horizontal bar graph, line graph, pie chart, ring chart, scatter plot.
Use it to create your educational infograms.
"A chart can take a large variety of forms, however there are common features that provide the chart with its ability to extract meaning from data.
Typically the data in a chart is represented graphically, since humans are generally able to infer meaning from pictures quicker than from text. Text is generally used only to annotate the data.
One of the more important uses of text in a graph is the title. A graph's title usually appears above the main graphic and provides a succinct description of what the data in the graph refers to.
Dimensions in the data are often displayed on axes. If a horizontal and a vertical axis are used, they are usually referred to as the x-axis and y-axis respectively. Each axis will have a scale, denoted by periodic graduations and usually accompanied by numerical or categorical indications. Each axis will typically also have a label displayed outside or beside it, briefly describing the dimension represented. If the scale is numerical, the label will often be suffixed with the unit of that scale in parentheses. ...
The data of a chart can appear in all manner of formats, and may include individual textual labels describing the datum associated with the indicated position in the chart. The data may appear as dots or shapes, connected or unconnected, and in any combination of colors and patterns. Inferences or points of interest can be overlaid directly on the graph to further aid information extraction.
When the data appearing in a chart contains multiple variables, the chart may include a legend (also known as a key). A legend contains a list of the variables appearing in the chart and an example of their appearance. This information allows the data from each variable to be identified in the chart." [Chart. Wikipedia]
The shapes example "Design elements - Education charts" was created using the ConceptDraw PRO diagramming and vector drawing software extended with the Education Infographics solition from the area "Business Infographics" in ConceptDraw Solution Park.
Graphs and charts

The vector stencils library "Education maps" contains 44 state map contours with capitals and major cities: the Group of Twenty (G20) state maps, EU state maps and World map.
Use it to visualize geospatial information in your education infograms.
"The Group of Twenty (also known as the G-20 or G20) is a forum for the governments and central bank governors from 20 major economies. The members, shown highlighted on the map at right, include 19 individual countries—Argentina, Australia, Brazil, Canada, China, France, Germany, India, Indonesia, Italy, Japan, Republic of Korea, Mexico, Russian Federation, Saudi Arabia, South Africa, Turkey, United Kingdom, United States—and the European Union (EU). The EU is represented by the European Commission and by the ECB." [G-20 major economies. Wikipedia]
The G-20 state map contours example "Design elements - Education maps (G-20)" was created using the ConceptDraw PRO diagramming and vector drawing software extended with the Education Infographics solition from the area "Business Infographics" in ConceptDraw Solution Park.
The Group of Twenty (G-20) state maps
-state-maps-design-elements---education-maps-(g-20).png--diagram-flowchart-example.png)
 Education
This solution extends ConceptDraw PRO and ConceptDraw MINDMAP with specific content that helps illustrate educational documents, presentations, and websites quickly and easily with astronomy, chemistry, math and physics vector pictures and clip art.
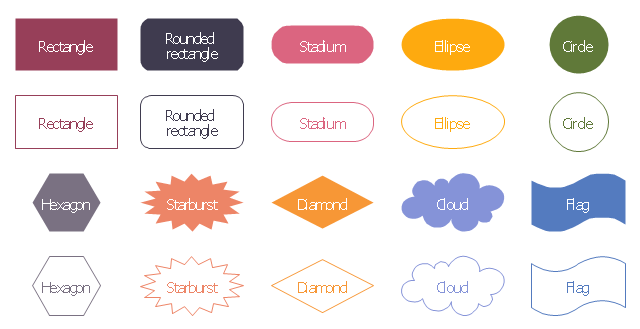
The vector stencils library "Education diagram" contains 20 solid and transparent geometric shapes: rectangle, rounded rectangle, ellipse, cloud, circle, diamond, hexagon, starburst, flag.
Use it to illustrate your education infograms with block diagrams.
"A diagram is a two-dimensional geometric (can be three-dimensional also) symbolic representation of information according to some visualization technique. They have been used since ancient times but became more prevalent during the Enlightenment. Sometimes, the technique uses a three-dimensional visualization which is then projected onto the two-dimensional surface. The word graph is sometimes used as a synonym for diagram." [Diagram. Wikipedia]
The geometric shapes example "Design elements - Education diagram" was created using the ConceptDraw PRO diagramming and vector drawing software extended with the Education Infographics solition from the area "Business Infographics" in ConceptDraw Solution Park.
Diagram blocks
 Biology
Biology solution extends ConceptDraw PRO software with samples, templates and libraries containing biological vector symbols, to help you create scientific and educational designs in the field of biology.
How To Create Presentation for Trainings and Learning process


- Education | Entity-Relationship Diagram (ERD) | Development of ...
- Map Infographic Creator | Best Tool for Infographic Construction ...
- Concept maps with ConceptDraw PRO | Education | What is ...
- Meter Dashboard | Composition Dashboard | Spatial Dashboard ...
- How To Create Presentation for Trainings and Learning process ...
- ConceptDraw Solution Park | Universal Diagramming Area ...
- Education Mind Maps | Presentations in Educational Process ...
- Applications | Science and Education Area | Mathematics ...
- Presentation Exchange | Astronomy | Education | Maps Of The Planet
- Divided Bar Diagrams | Work Flow Process Chart | Process ...
- Chemistry | Education | Tryptophan molecule ball-and-stick model ...
- Education | Gravity filtration of liquids | Chemical Laboratory
- Education Mind Maps | Applications | eLearning for Skype | Mind ...
- Design elements - ER diagram (Chen notation) | Crow's foot ERD ...
- Education Mind Maps | Skype as eLearning Platform | eLearning for ...
- Venn Diagram Examples for Problem Solving . Quantum Information ...
- Pyramid Diagram
- Basic Flowchart Symbols | Cross-Functional Flowchart (Swim Lanes ...
- How to Draw Biology Diagrams Using ConceptDraw PRO | Biology ...
- Crow's foot ERD - Educational data base | Entity-Relationship ...