HelpDesk
How to Add a Telecommunication Network Diagram to a PowerPoint Presentation

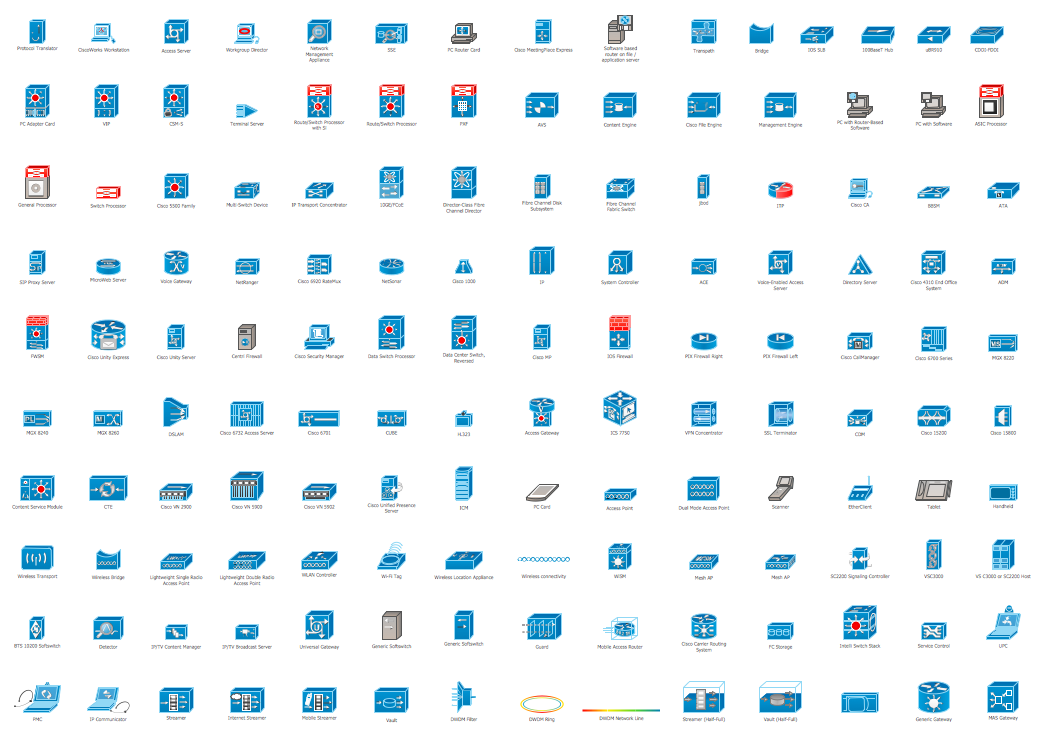
Cisco Routers. Cisco icons, shapes, stencils and symbols

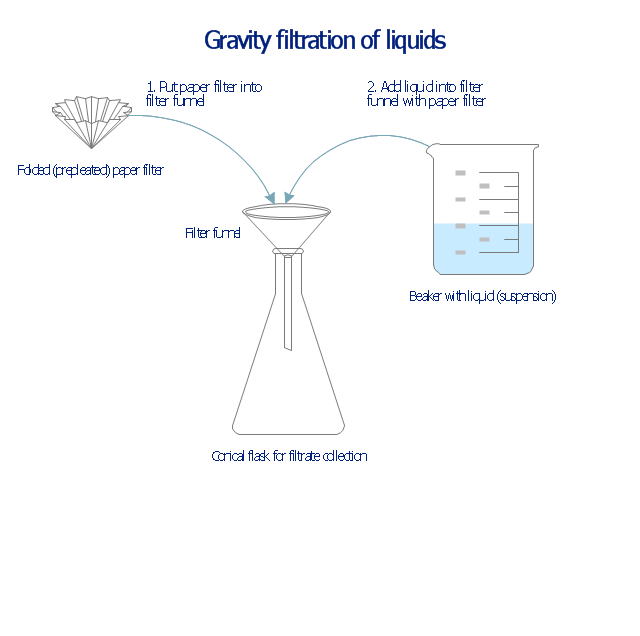
This chemical laboratory technique drawing depict gravity filtration of liquid through prepleated paper filter step-by-step.
1. Put folded filter paper cone into glass filter funnel inserted into neck of conical (Erlenmeyer) flask.
2. Add liquid suspension from the glass beaker with a spout into the funnel with paper filter.
3. Collect filtrate in the conical flask and solid on the paper filter in the funnel.
"Filtration is commonly the mechanical or physical operation which is used for the separation of solids from fluids (liquids or gases) by interposing a medium through which only the fluid can pass. The fluid that pass through is called a filtrate. Oversize solids in the fluid are retained, but the separation is not complete; solids will be contaminated with some fluid and filtrate will contain fine particles (depending on the pore size and filter thickness)." [Filtration. Wikipedia]
"Filter paper is a semi-permeable paper barrier placed perpendicular to a liquid or air flow. It is used to separate fine solids from liquids or air." [Filter paper. Wikipedia]
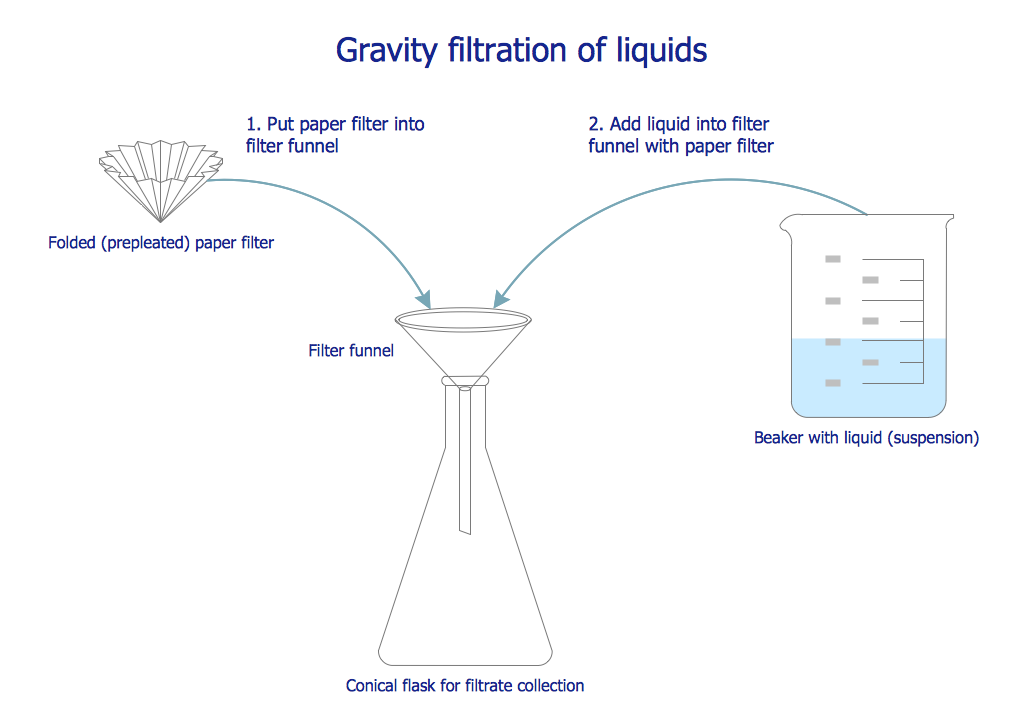
The chemical lab drawing example "Gravity filtration of liquids" was created using the ConceptDraw PRO diagramming and vector drawing software extended with the Chemistry solution from the Science and Education area of ConceptDraw Solution Park.
1. Put folded filter paper cone into glass filter funnel inserted into neck of conical (Erlenmeyer) flask.
2. Add liquid suspension from the glass beaker with a spout into the funnel with paper filter.
3. Collect filtrate in the conical flask and solid on the paper filter in the funnel.
"Filtration is commonly the mechanical or physical operation which is used for the separation of solids from fluids (liquids or gases) by interposing a medium through which only the fluid can pass. The fluid that pass through is called a filtrate. Oversize solids in the fluid are retained, but the separation is not complete; solids will be contaminated with some fluid and filtrate will contain fine particles (depending on the pore size and filter thickness)." [Filtration. Wikipedia]
"Filter paper is a semi-permeable paper barrier placed perpendicular to a liquid or air flow. It is used to separate fine solids from liquids or air." [Filter paper. Wikipedia]
The chemical lab drawing example "Gravity filtration of liquids" was created using the ConceptDraw PRO diagramming and vector drawing software extended with the Chemistry solution from the Science and Education area of ConceptDraw Solution Park.
Liquid filtration through filter paper
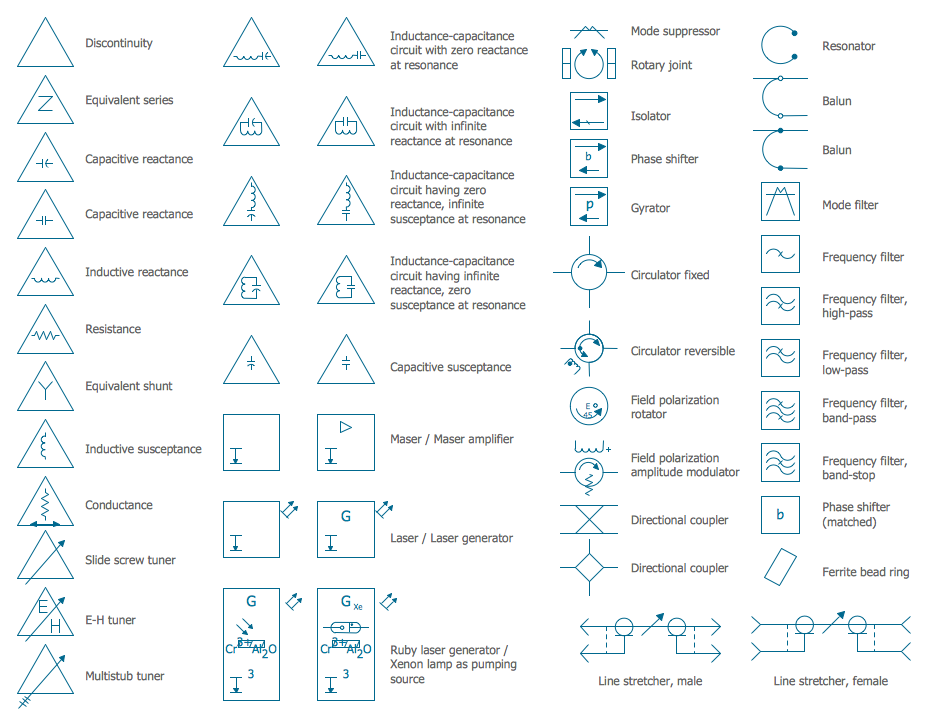
Electrical Symbols — VHF UHF SHF
Chemistry Symbols and Meanings
Process Flow Diagram Symbols

 Chemistry
This solution extends ConceptDraw DIAGRAM software with samples, template and libraries of vector stencils for drawing the Chemistry Illustrations for science and education.
Electrical Symbols, Electrical Diagram Symbols

Network Gateway Router


Cisco Products Additional. Cisco icons, shapes, stencils and symbols
Local area network (LAN). Computer and Network Examples
 diagram")
Network Diagram Software. LAN Network Diagrams. Physical Office Network Diagrams

This cause and effect diagram sample was redesigned from the Wikimedia Commons file: Fishbone BadCoffeeExample.jpg. [commons.wikimedia.org/ wiki/ File:Fishbone_ BadCoffeeExample.jpg]
This file is licensed under the Creative Commons Attribution-Share Alike 3.0 Unported license. [creativecommons.org/ licenses/ by-sa/ 3.0/ deed.en]
The fishbone diagram example "Bad coffee" was created using the ConceptDraw PRO diagramming and vector drawing software extended with the Fishbone Diagrams solution from the Management area of ConceptDraw Solution Park.
Fishbone diagram

HelpDesk
How to Filter Data in Your Mind Map

- Gravity filtration of liquids | Diagram Of Gravity Filtration Techniques
- Diagram Of Filtration
- Diagram Of A Lab Filter Funnel
- Schematic Diagram Of Bag Filter
- Diagram Filtration Through Filter Paper
- Diagram Of Filter Paper
- Gravity filtration of liquids | Water cycle diagram | Design elements ...
- Filter Press Icon Process Flow Diagram
- Filter Or Strainer Process Flow Diagram Symbols
- Electrical Symbols — Inductors | Air Filter Block Diagram
- Filter Press Visio
- Filter Block Diagram Symbol
- Laboratory equipment - Vector stencils library | Gravity filtration of ...
- Electrical Symbols — Inductors | Workflow diagram - Weather ...
- Electrical Symbols, Electrical Diagram Symbols | Chemistry ...
- Electrical Symbols, Electrical Diagram Symbols | Filter Press P
- Chemistry Symbols and Meanings | Process Flow Diagram Symbols ...
- Filter Pfd Diagram Icon
- Process Flow Chart Symbols | Process Flow Diagram Symbols ...
- Filter Schematic Symbol