Process Flowchart
The main reason of using Process Flowchart or PFD is to show relations between major parts of the system. Process Flowcharts are used in process engineering and chemical industry where there is a requirement of depicting relationships between major components only and not include minor parts. Process Flowcharts for single unit or multiple units differ in their structure and implementation. ConceptDraw PRO is Professional business process mapping software for making Process flowcharts, Process flow diagram, Workflow diagram, flowcharts and technical illustrations for business documents and also comprehensive visio for mac application. Easier define and document basic work and data flows, financial, production and quality management processes to increase efficiency of your business with ConcepDraw PRO. Business process mapping software with Flowchart Maker ConceptDraw PRO includes extensive drawing tools, rich examples and templates, process flowchart symbols and shape libraries, smart connectors that allow you create the flowcharts of complex processes, process flow diagrams, procedures and information exchange. Process Flowchart Solution is project management workflow tools which is part ConceptDraw Project marketing project management software. Drawing charts, diagrams, and network layouts has long been the monopoly of Microsoft Visio, making Mac users to struggle when needing such visio alternative like visio for mac, it requires only to view features, make a minor edit to, or print a diagram or chart. Thankfully to MS Visio alternative like ConceptDraw PRO software, this is cross-platform charting and business process management tool, now visio alternative for making sort of visio diagram is not a problem anymore however many people still name it business process visio tools.
Business diagrams & Org Charts with ConceptDraw PRO
The business diagrams are in great demand, they describe the business processes, business tasks and activities which are executed to achieve specific organizational and business goals, increase productivity, reduce costs and errors. They let research and better understand the business processes. ConceptDraw PRO is a powerful professional cross-platform business graphics and business flowcharting tool which contains hundreds of built-in collections of task-specific vector stencils and templates. They will help you to visualize and structure information, create various Business flowcharts, maps and diagrams with minimal efforts, and add them to your documents and presentations to make them successful. Among them are Data flow diagrams, Organization charts, Business process workflow diagrams, Audit flowcharts, Cause and Effect diagrams, IDEF business process diagrams, Cross-functional flowcharts, PERT charts, Timeline diagrams, Calendars, Marketing diagrams, Pyramids, Target diagrams, Venn diagrams, Comparison charts, Analysis charts, Dashboards, and many more. Being a cross-platform application, ConceptDraw PRO is very secure, handy, free of bloatware and one of the best alternatives to Visio for Mac users.
HelpDesk
How to Draw a Gantt Chart Using ConceptDraw PRO
A Gantt chart is intended to provide a visualization of a project schedule. It is developed to help planning, coordinating, and tracking on project tasks implementation. One of the most critical resources for a project implementation is a time resources. Gantt chart - is one of the most convenient and popular way of graphical representation of a project tasks progress in conjunction with the corresponding time consumption. Gantt chart's function is to show project tasks completion in a progress, and to make a project manager sure that project tasks were completed on time. ConceptDraw Office is a clear and easy-to-use tool for project management. It is a very handy visual tool that helps make a project processing clear.HelpDesk
How To Create a PERT Chart
Project Evaluation and Review Technique (PERT) is a method of project tasks evaluation and analysis. PERT - is a method of analyzing the tasks required to complete the project. It includes analysis of the time required to complete each task, as well as the determination of the time required to carry out the whole project. PERT was developed to facilitate the planning of huge and complex projects. PERT is used for very large, complex, and non-standard projects. Technology implies the presence of uncertainty, making it possible to develop a schedule of the project without a precise information on details and time required for all of its components. The most popular part of PERT is a method of the critical path, based on the construction of the network schedule (PERT network diagram). ConceptDraw Office delivers you the best way to create PERT chart for your project using compatibility between ConceptDraw PROJECT and ConceptDraw PRO.HelpDesk
How to Draw a Pictorial Chart in ConceptDraw PRO
Pictorial Infographics is used to visually present data comparison. Pictorial charts use relative sizes or repetitions of the same icon, picture, or symbol to show data relation. Using a Pictorial chart to show business data patterns and trends will add much more efficiency to your business communications. Finding the right tool for the job can sometimes be tricky. Developing sophisticated and effective infographics can require toolsthat may span many different products. Fortunately, ConceptDraw PRO has everything you need to create polished Pictorial Infographics that beautifully and accurately represent your story, no matter how complex it may be.HelpDesk
How to Create a Timeline Diagram in ConceptDraw PRO
A Timeline is a chart which displays a project plan schedule in chronological order. A Timeline is used in project management to depict project milestones and visualize project phases, and show project progress. The graphic form of a timeline makes it easy to understand critical project milestones, such as the progress of a project schedule. Timelines are particularly useful for project scheduling or project management when accompanied with a Gantt chart. It captures the main of what the project will accomplish and how it will be done. making a project timeline is one of the most important skills a project manager needs have. Making comprehensive, accurate timelines allows you getting every project off in the best way. ConceptDraw PRO allows you to draw a timeline charts using special library.HelpDesk
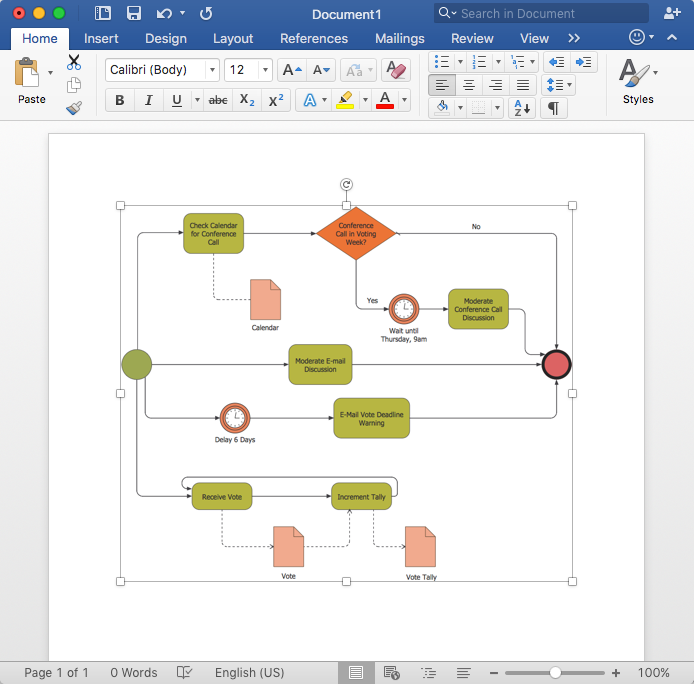
How to Add a Business Process Diagram to MS Word Document
ConceptDraw PRO allows you to easily create business process diagrams and then add them to a MS Word document.HelpDesk
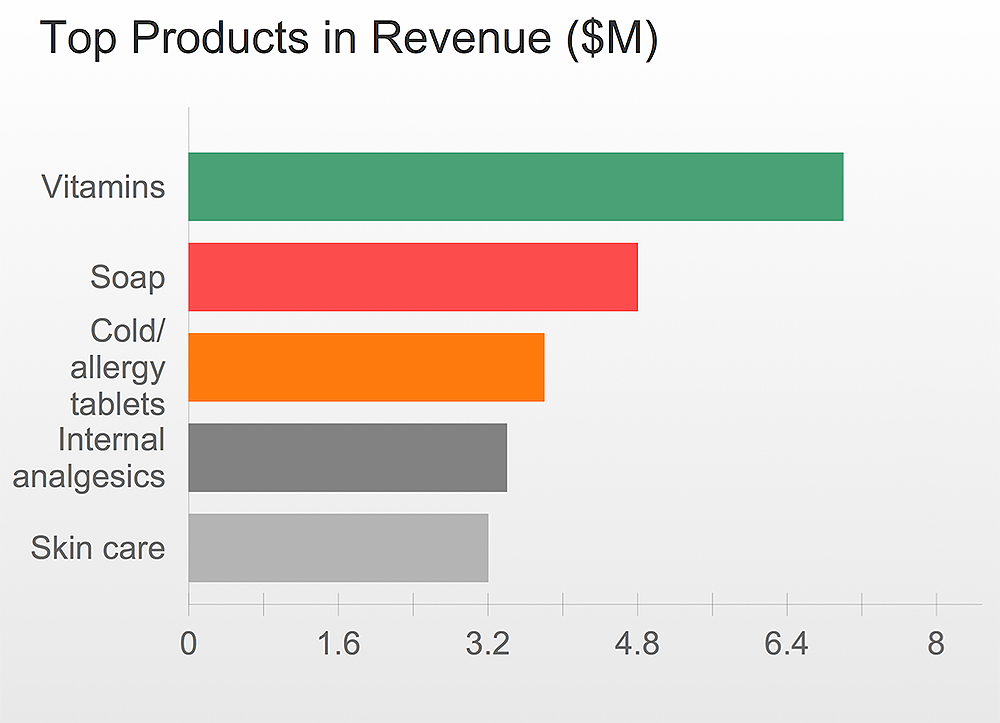
How to Draw a Pie Chart Using ConceptDraw PRO
A pie chart represents data, in a clear and easy to read round (pie) form. A circular pie chart is divided into sections (slice). Each "slice" depicts the It reflects the proportion of each component in the whole "pie". This type of chart is most often used for the visualization of statistical data. That is why pie charts are widely used in marketing. As pie charts show proportional proportional parts of a whole, they are good for various visual comparisons. For example, it is difficult to imagine a more intuitive way to show segmentation and market share. ConceptDraw PRO allows you to draw a simple and clear Pie Chart using the Pie Charts solution.Pyramid Diagram
The Project Management Triangle Diagram depicts three main constraints of any project: scope, time and cost. Projects have to comply with the specified scope, projects should be finished in time and projects need to consume the budget. Each of the constraints represents one side of the triangle, and any change in budget or timing or scope affects the entire diagram. This diagram was made using ConceptDraw Office suite including best marketing project management software extended with collection of tools for creative project management software and project management reporting software symbols.HelpDesk
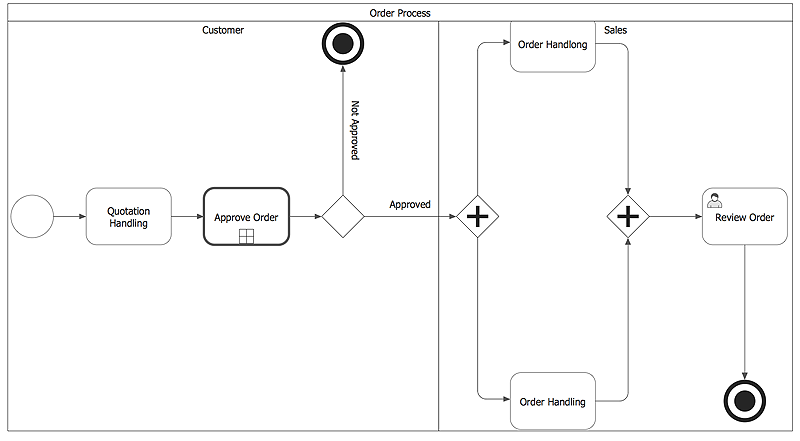
How to Create a Business Process Diagram
Making a Business Process diagram involves many different elements that can be managed using ConceptDraw PRO. The ability to design Business Process diagrams is delivered by the Business Process Diagrams solution.ConceptDraw PRO The best Business Drawing Software
ConceptDraw PRO is new software for business and technical drawing. Powerful business drawing tools, extensive libraries with pre-drawn shapes, free samples of business drawings, technical drawings and flowcharts, support of many graphic formats enable users to visually develop their business drawings charts and diagrams in any combination of drawings, diagrams and flow charts.Business Diagram Software
When managing the projects, people, or networks, there are daily designed and used different types of Business diagrams, so the powerful drawing software will be very useful for this. ConceptDraw PRO with large quantity of business solutions will meet your needs and will help you convey your ideas successful and rapidly, no matter are you professional or beginner. It is the best choice for business specialists and technical professionals who need quickly and easily explore, visualize, and communicate information. ConceptDraw PRO business diagram software is the most powerful business software and relational charting software. Create advanced, completely customizable Business Process Diagrams, Business Flow Charts, Work Flow Diagrams, Organizational Charts, Audit diagrams, Marketing diagrams, Value Stream Maps, TQM diagrams, ERD diagrams, EPC diagrams, Cause and Effect diagrams, Infographics, Dashboards, and other Relational business diagrams from your data using the powerful drawing tools of ConceptDraw Solution Park.
HelpDesk
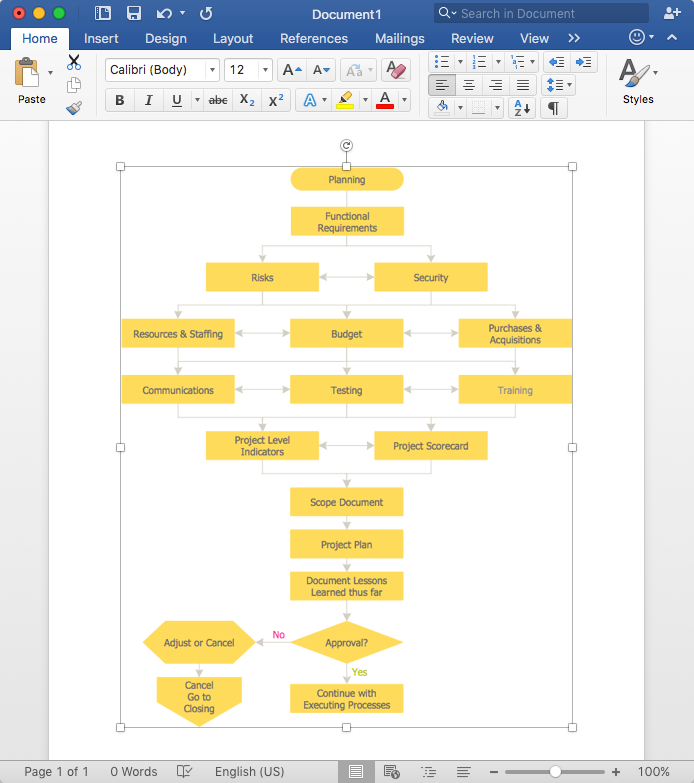
How to Add a Flowchart to MS Word Document
ConceptDraw PRO allows you to easily create flowcharts and then insert them into a MS Word document.HelpDesk
How to Save a Drawing as a Graphic File
ConceptDraw PRO can save your drawings and diagrams in a number of highly useful formats, including graphic files. You can save your drawing as a .PNG, .JPG, or other graphic format file.HelpDesk
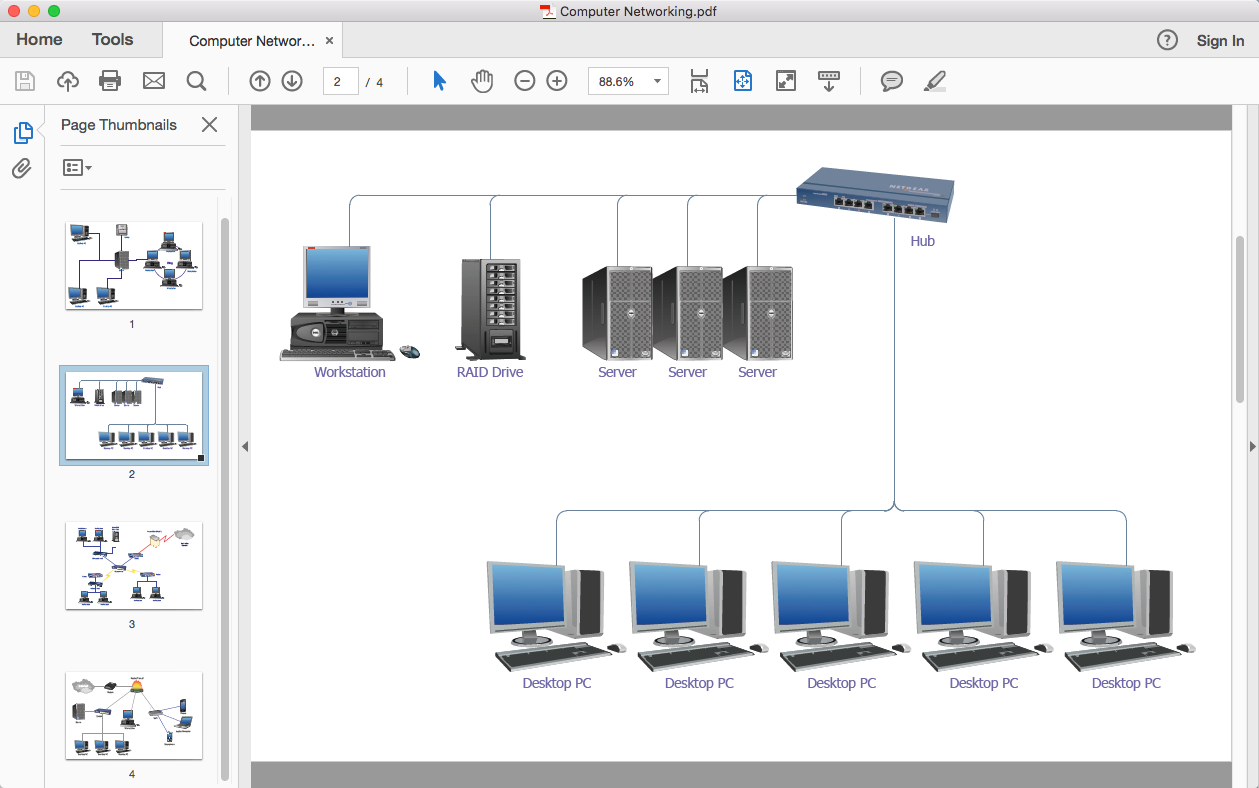
How To Convert a Computer Network Diagram to Adobe PDF
ConceptDraw PRO allows you to easy transmit your network documentation between different computers with different operating systems and applications using it's export capabilities.You can get clear network documentation pack in pdf format and avoid any problems while communicating it with stakeholders.- How to Draw an Organization Chart | Gant Chart in Project ...
- PERT chart - Project management plan | Bar Diagrams for Problem ...
- Sample Project Flowchart. Flowchart Examples | Flowchart ...
- Get Drawing Project By Company
- Project timeline diagram - New business project plan | How to ...
- Business Process Reengineering Examples | Gantt chart examples ...
- How to Draw an Organization Chart | Organizational Structure | How ...
- Communication Tool for Remote Project Management | Project ...
- Gant Chart in Project Management | Army Flow Charts | How to ...
- Gant Chart in Project Management | How to Draw a Gantt Chart ...
- Project timeline diagram
- Business Project Charts
- Project Timeline | Examples of Flowcharts , Org Charts and More ...
- Examples of Flowcharts , Org Charts and More | Program Evaluation ...
- Gantt chart examples | Business diagrams & Org Charts with ...
- Communication Tool for Remote Project Management | Gantt Chart ...
- Flow Chart In Project Management
- Software Work Flow Process in Project Management with Diagram ...
- How To Make A Business Diagram For Project


