 Fishbone Diagram
Fishbone Diagrams solution extends ConceptDraw PRO software with templates, samples and library of vector stencils for drawing the Ishikawa diagrams for cause and effect analysis.
 Universal Diagramming Area
This area collects solutions for drawing diagrams, charts, graphs, matrices, geographic and road maps for education, science, engineering, business.
Simple & Fast Diagram Software
It is so simple making the drawing process easier and faster. you just need to choose the right drawing software.ConceptDraw Arrows10 Technology - This is so easy and fast to draw any type of diagram with any degree of complexity.

 Education
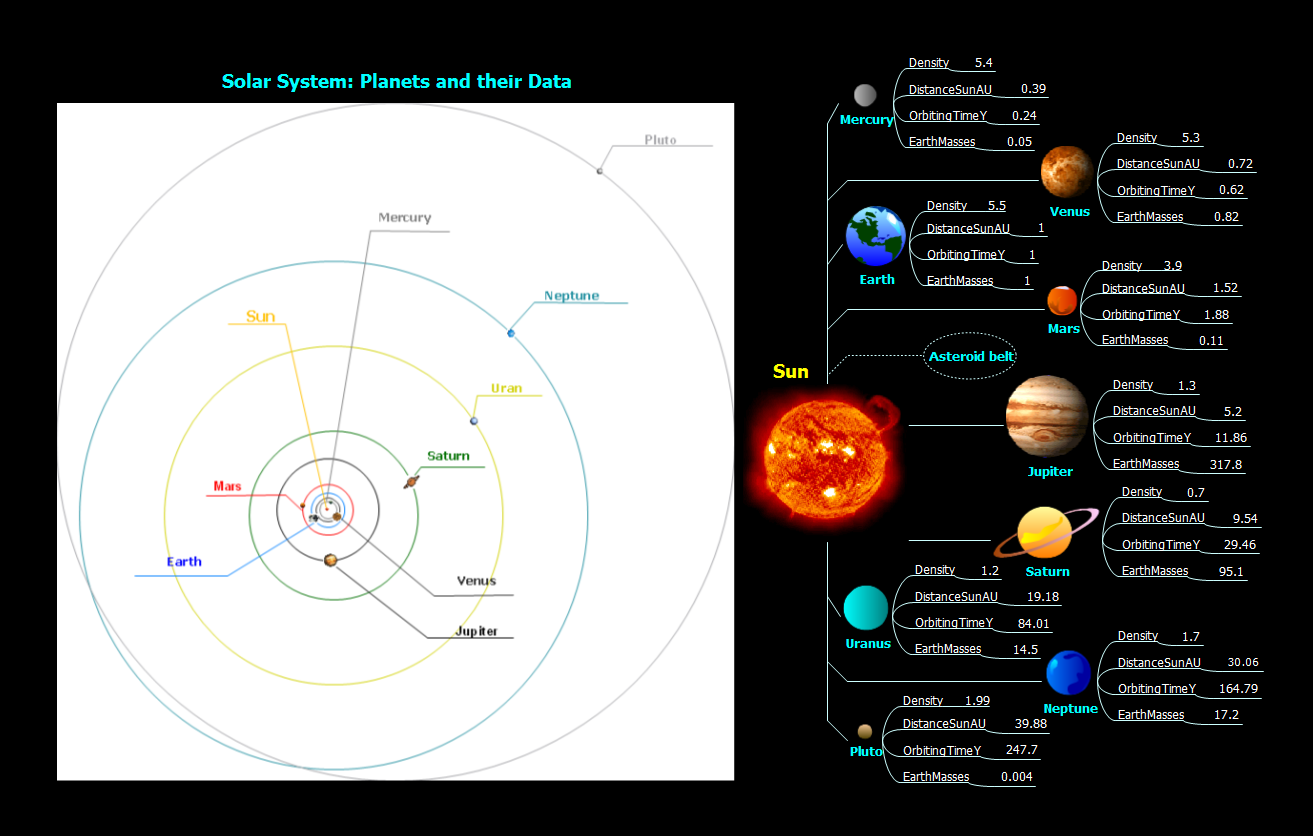
This solution extends ConceptDraw PRO and ConceptDraw MINDMAP with specific content that helps illustrate educational documents, presentations, and websites quickly and easily with astronomy, chemistry, math and physics vector pictures and clip art.
Fishbone Diagram Problem Solving
The Ishikawa diagram, Cause and Effect diagram, Fishbone diagram — all they are the names of one and the same visual method for working with causal connections. Originally invented by Kaoru Ishikawa to control the process quality, the Ishikawa diagram is well proven in other fields of management and personal scheduling, events planning, time management. It is a chart in the form of a fish, whose head is a problem, the fins are variants for its causes.To design easily the Fishbone diagram, you can use a special ConceptDraw PRO vector graphic and diagramming software which contains the powerful tools for Fishbone diagram problem solving offered by Fishbone Diagrams solution for the Management area of ConceptDraw Solution Park.
 Total Quality Management TQM Diagrams
Total Quality Management Diagrams solution extends ConceptDraw PRO software with samples, templates and vector stencils library for drawing the TQM flowcharts.
Using Fishbone Diagrams for Problem Solving
Problems are obstacles and challenges that one should overcome to reach the goal. They are an inseparable part of any business, and the success of an enterprise often depends on ability to solve all problems effectively. The process of problem solving often uses rational approach, helping to find a suitable solution.Using Fishbone Diagrams for Problem Solving is a productive and illustrative tool to identify the most important factors causing the trouble. ConceptDraw PRO extended with Fishbone Diagrams solution from the Management area of ConceptDraw Solution Park is a powerful tool for problem solving with Fishbone Ishikawa diagram graphic method.
 Seven Management and Planning Tools
Seven Management and Planning Tools solution extends ConceptDraw PRO and ConceptDraw MINDMAP with features, templates, samples and libraries of vector stencils for drawing management mind maps and diagrams.
How To Create Presentation for Trainings and Learning process
Learning via presentations is used widely in education. This is a frequently used tool on trainings, especially for remote training via Skype.
How To Create Professional Diagrams
No need for any special drawing skills to create professional looking diagrams outside of your knowledge base. ConceptDraw PRO takes care of the technical side.Use templates, samples and special libraries for your needs.
Best Value — Total Quality Management
The Total Quality Management Diagram solution helps your organization visualize business and industrial processes. Create Total Quality Management diagrams for business process with ConceptDraw software.MS Visio Look a Like Diagrams
No need for any special drawing skills to create professional looking diagrams outside of your knowledge base. ConceptDraw PRO takes care of the technical details, allowing you to focus on your job, not the drawing.ConceptDraw PRO delivers full-functioned alternative to MS Visio. ConceptDraw PRO supports import of Visio files. ConceptDraw PRO supports flowcharting, swimlane, orgchart, project chart, mind map, decision tree, cause and effect, charts and graphs, and many other diagram types.
Total Quality Management with ConceptDraw
Total Quality Management (TQM) system is the management method where the confidence in quality of all organization processes is placed foremost. The given method is widely used in production, in educational system, in government organizations and so on.ConceptDraw Arrows10 Technology
When you are connecting existing objects you can control the diagram structure by changing selection order.This is how diagramming software should work. You are able to draw a diagram as quickly as the ideas come to you.
 ConceptDraw Solution Park
ConceptDraw Solution Park collects graphic extensions, examples and learning materials
- Fishbone Diagram | Universal Diagramming Area | Education |
- Education | Using Fishbone Diagrams for Problem Solving ...
- Using Fishbone Diagrams for Problem Solving | Business ...
- Illustration | ConceptDraw Solution Park | Education |
- Business Productivity Diagramming | Total Quality Management with ...
- Education | Presentations in Educational Process | Universal ...
- PM Easy | Management | Collaboration Area |
- PM Easy | Looking at ConceptDraw MINDMAP as a Replacement for ...
- Education | Business People Clipart | Marketing - Design Elements |
- Business Productivity Diagramming | Business Productivity ...
- Seven Management and Planning Tools | Social Media Response ...
- Basic Diagramming | Education | Basic Diagramming |
- Education | Graphics Software for Business | Mac Diagramming ...
- Business Productivity Diagramming | Fishbone Diagram ...
- Presentations in Educational Process | Education | How To Create ...
- Excellent Examples of Infographic Maps | Spatial Infographics | PM ...
- Fishbone Diagram | Business Productivity Diagramming | Business ...
- Diagramming | Data Flow Diagramm | ConceptDraw .com
- Management | Fishbone Diagram | Business Productivity ...
- Business Productivity Diagramming | Ishikawa diagram - Factors ...


