This marketing diagram sample illustrates Porter five forces model. It was designed on the base of the Wikimedia Commons file: Porters five forces.PNG.
[commons.wikimedia.org/ wiki/ File:Porters_ five_ forces.PNG]
This file is licensed under the Creative Commons Attribution-Share Alike 3.0 Unported license. [creativecommons.org/ licenses/ by-sa/ 3.0/ deed.en]
"Porter five forces analysis is a framework for industry analysis and business strategy development. It draws upon industrial organization (IO) economics to derive five forces that determine the competitive intensity and therefore attractiveness of a market. Attractiveness in this context refers to the overall industry profitability. An "unattractive" industry is one in which the combination of these five forces acts to drive down overall profitability. A very unattractive industry would be one approaching "pure competition", in which available profits for all firms are driven to normal profit. This analysis is associated with its principal innovator Michael E. Porter of Harvard University (as of 2014).
Three of Porter's five forces refer to competition from external sources. The remainder are internal threats.
Porter referred to these forces as the micro environment, to contrast it with the more general term macro environment. They consist of those forces close to a company that affect its ability to serve its customers and make a profit. A change in any of the forces normally requires a business unit to re-assess the marketplace given the overall change in industry information. The overall industry attractiveness does not imply that every firm in the industry will return the same profitability. Firms are able to apply their core competencies, business model or network to achieve a profit above the industry average. A clear example of this is the airline industry. As an industry, profitability is low and yet individual companies, by applying unique business models, have been able to make a return in excess of the industry average.
Porter's five forces include - three forces from 'horizontal' competition: the threat of substitute products or services, the threat of established rivals, and the threat of new entrants; and two forces from 'vertical' competition: the bargaining power of suppliers and the bargaining power of customers.
This five forces analysis, is just one part of the complete Porter strategic models. The other elements are the value chain and the generic strategies." [Porter five forces analysis. Wikipedia]
The chart example "Five forces model diagram" was created using the ConceptDraw PRO diagramming and vector drawing software extended with the Marketing Diagrams solution from the Marketing area of ConceptDraw Solution Park.
Marketing chart
Bar Diagrams for Problem Solving. Create manufacturing and economics bar charts with Bar Graphs Solution

This circle-spoke diagram sample shows the Porter five forces model. It was designed on the base of the Wikimedia Commons file: Modelo Porter.png. [commons.wikimedia.org/ wiki/ File:Modelo_ Porter.png]
"Porter's five forces analysis is a framework that attempts to analyze the level of competition within an industry and business strategy development. It draws upon industrial organization (IO) economics to derive five forces that determine the competitive intensity and therefore attractiveness of an Industry. Attractiveness in this context refers to the overall industry profitability. An "unattractive" industry is one in which the combination of these five forces acts to drive down overall profitability. A very unattractive industry would be one approaching "pure competition", in which available profits for all firms are driven to normal profit. This analysis is associated with its principal innovator Michael E. Porter of Harvard University. ...
Porter's five forces include – three forces from 'horizontal' competition: the threat of substitute products or services, the threat of established rivals, and the threat of new entrants; and two forces from 'vertical' competition: the bargaining power of suppliers and the bargaining power of customers." [Porter's five forces analysis. Wikipedia]
The hub-and-spoke diagram example "Porter five forces model" was created using the ConceptDraw PRO diagramming and vector drawing software extended with the Circle-Spoke Diagrams solution from the area "What is a Diagram" of ConceptDraw Solution Park.
Circle-spoke diagram

Competitor Analysis

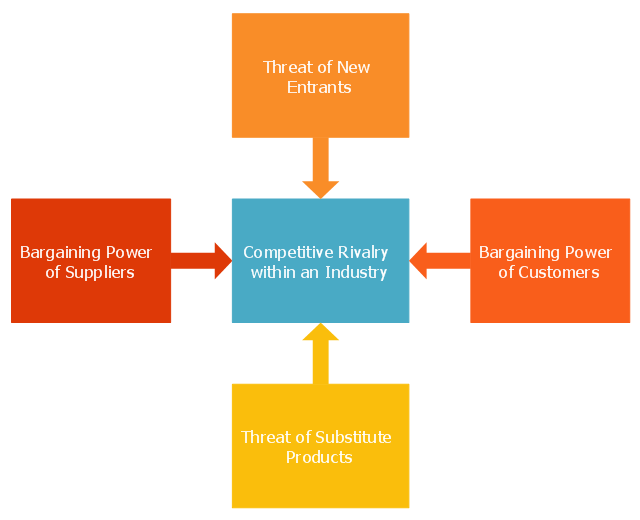
"Porter five forces analysis is a framework for industry analysis and business strategy development. It draws upon industrial organization (IO) economics to derive five forces that determine the competitive intensity and therefore attractiveness of a market. Attractiveness in this context refers to the overall industry profitability. An "unattractive" industry is one in which the combination of these five forces acts to drive down overall profitability. A very unattractive industry would be one approaching "pure competition", in which available profits for all firms are driven to normal profit.
Three of Porter's five forces refer to competition from external sources. The remainder are internal threats.
Porter referred to these forces as the micro environment, to contrast it with the more general term macro environment. They consist of those forces close to a company that affect its ability to serve its customers and make a profit. A change in any of the forces normally requires a business unit to re-assess the marketplace given the overall change in industry information. The overall industry attractiveness does not imply that every firm in the industry will return the same profitability. Firms are able to apply their core competencies, business model or network to achieve a profit above the industry average. A clear example of this is the airline industry. As an industry, profitability is low and yet individual companies, by applying unique business models, have been able to make a return in excess of the industry average.
Porter's five forces include - three forces from 'horizontal' competition: the threat of substitute products or services, the threat of established rivals, and the threat of new entrants; and two forces from 'vertical' competition: the bargaining power of suppliers and the bargaining power of customers.
This five forces analysis, is just one part of the complete Porter strategic models. The other elements are the value chain and the generic strategies." [Porter five forces analysis. Wikipedia]
The block diagram example "Porter's five forces model" was created using the ConceptDraw PRO diagramming and vector drawing software extended with the Block Diagrams solution from the area "What is a Diagram" of ConceptDraw Solution Park.
Block diagram

Types of Flowcharts


Flowchart Maker

Process Flow Diagram Symbols

Percentage Spider Chart

Basic Diagramming


Internal Audit Process

Process Engineering

What is a Quality Management

Influence Diagram

How Do Fishbone Diagrams Solve Manufacturing Problems

Feature Comparison Chart Software

Cross-Functional Flowchart


The vector stencils library "Workflow diagrams" contains 54 symbol icons for drawing the work flow charts.
Use these clipart to represent information flow, automation of business processes, business process re-engineering, accounting, management, and human resources tasks in industry, business, and manufacturing.
"A workflow consists of an orchestrated and repeatable pattern of business activity enabled by the systematic organization of resources into processes that transform materials, provide services, or process information. It can be depicted as a sequence of operations, declared as work of a person or group, an organization of staff, or one or more simple or complex mechanisms.
From a more abstract or higher-level perspective, workflow may be a view or representation of real work, thus serving as a virtual representation of actual work. The flow being described may refer to a document, service or product that is being transferred from one step to another.
Workflows may be viewed as one fundamental building block to be combined with other parts of an organisation's structure such as information silos, teams, projects, policies and hierarchies." [Workflow. Wikipedia]
The clipart example "Design elements - Workflow diagram" was drawn using the ConceptDraw PRO diagramming and vector drawing software extended with the Workflow Diagrams solution from the Business Processes area of ConceptDraw Solution Park.
Workflow symbols
HR Flowchart Symbols

Cause and Effect Diagrams

- Draw A Block Daigram For A Organization
- Organizational Structure | How to Draw an Organization Chart ...
- How To Draw Different Types Of Chart In Industrial Management
- Competitor Analysis | Matrix Organization Structure | Pyramid ...
- Five forces model - Template
- Block diagram - Porter's five forces model
- Block diagram - Porter's five forces model | Marketing | Marketing ...
- Block diagram - Porter's five forces model | Project Management ...
- Block diagram - Porter's five forces model | Marketing Diagrams ...
- Draw Environmental Organization Diagram
- Block diagram - Porter's five forces model | Competitor Analysis ...
- How to Draw an Organization Chart | Audit Flowchart Symbols ...
- How to Create a SIPOC Diagram Using ConceptDraw PRO | NIH IT ...
- Industrial Process Diagram
- Business Productivity - Marketing | Porter's value chain matrix ...
- How to Draw Business Process Diagrams with RapidDraw Interface ...
- How to Draw Physics Diagrams in ConceptDraw PRO | Block ...
- How to Purchase ConceptDraw Products for Academic/Nonprofit ...
- Block diagram - Porter's five forces model
- Block diagram - Porter's five forces model | Cisco Network ...