"Porter five forces analysis is a framework for industry analysis and business strategy development. It draws upon industrial organization (IO) economics to derive five forces that determine the competitive intensity and therefore attractiveness of a market. Attractiveness in this context refers to the overall industry profitability. An "unattractive" industry is one in which the combination of these five forces acts to drive down overall profitability. A very unattractive industry would be one approaching "pure competition", in which available profits for all firms are driven to normal profit.
Three of Porter's five forces refer to competition from external sources. The remainder are internal threats.
Porter referred to these forces as the micro environment, to contrast it with the more general term macro environment. They consist of those forces close to a company that affect its ability to serve its customers and make a profit. A change in any of the forces normally requires a business unit to re-assess the marketplace given the overall change in industry information. The overall industry attractiveness does not imply that every firm in the industry will return the same profitability. Firms are able to apply their core competencies, business model or network to achieve a profit above the industry average. A clear example of this is the airline industry. As an industry, profitability is low and yet individual companies, by applying unique business models, have been able to make a return in excess of the industry average.
Porter's five forces include - three forces from 'horizontal' competition: the threat of substitute products or services, the threat of established rivals, and the threat of new entrants; and two forces from 'vertical' competition: the bargaining power of suppliers and the bargaining power of customers.
This five forces analysis, is just one part of the complete Porter strategic models. The other elements are the value chain and the generic strategies." [Porter five forces analysis. Wikipedia]
The block diagram example "Porter's five forces model" was created using the ConceptDraw PRO diagramming and vector drawing software extended with the Block Diagrams solution from the area "What is a Diagram" of ConceptDraw Solution Park.
Block diagram

This circle-spoke diagram sample shows the Porter five forces model. It was designed on the base of the Wikimedia Commons file: Modelo Porter.png. [commons.wikimedia.org/ wiki/ File:Modelo_ Porter.png]
"Porter's five forces analysis is a framework that attempts to analyze the level of competition within an industry and business strategy development. It draws upon industrial organization (IO) economics to derive five forces that determine the competitive intensity and therefore attractiveness of an Industry. Attractiveness in this context refers to the overall industry profitability. An "unattractive" industry is one in which the combination of these five forces acts to drive down overall profitability. A very unattractive industry would be one approaching "pure competition", in which available profits for all firms are driven to normal profit. This analysis is associated with its principal innovator Michael E. Porter of Harvard University. ...
Porter's five forces include – three forces from 'horizontal' competition: the threat of substitute products or services, the threat of established rivals, and the threat of new entrants; and two forces from 'vertical' competition: the bargaining power of suppliers and the bargaining power of customers." [Porter's five forces analysis. Wikipedia]
The hub-and-spoke diagram example "Porter five forces model" was created using the ConceptDraw PRO diagramming and vector drawing software extended with the Circle-Spoke Diagrams solution from the area "What is a Diagram" of ConceptDraw Solution Park.
Circle-spoke diagram

Competitor Analysis

Marketing Charts

Functional Block Diagram

 Marketing Diagrams
Marketing Diagrams solution extends ConceptDraw DIAGRAM diagramming software with abundance of samples, templates and vector design elements intended for easy graphical visualization and drawing different types of Marketing diagrams and graphs, including Branding Strategies Diagram, Five Forces Model Diagram, Decision Tree Diagram, Puzzle Diagram, Step Diagram, Process Chart, Strategy Map, Funnel Diagram, Value Chain Diagram, Ladder of Customer Loyalty Diagram, Leaky Bucket Diagram, Promotional Mix Diagram, Service-Goods Continuum Diagram, Six Markets Model Diagram, Sources of Customer Satisfaction Diagram, etc. Analyze effectively the marketing activity of your company and apply the optimal marketing methods with ConceptDraw DIAGRAM software.
 Block Diagrams
Block diagrams solution extends ConceptDraw DIAGRAM software with templates, samples and libraries of vector stencils for drawing the block diagrams.
 Circle-Spoke Diagrams
Examples of subject areas that are well suited to this approach are marketing, business, products promotion, process modeling, market, resource, time, and cost analysis. Circle-Spoke Diagrams are successfully used in presentations, conferences, management documents, magazines, reportages, reviews, reports, TV, and social media.
 Marketing
This solution extends ConceptDraw DIAGRAM and ConceptDraw MINDMAP with Marketing Diagrams and Mind Maps (brainstorming, preparing and holding meetings and presentations, sales calls).
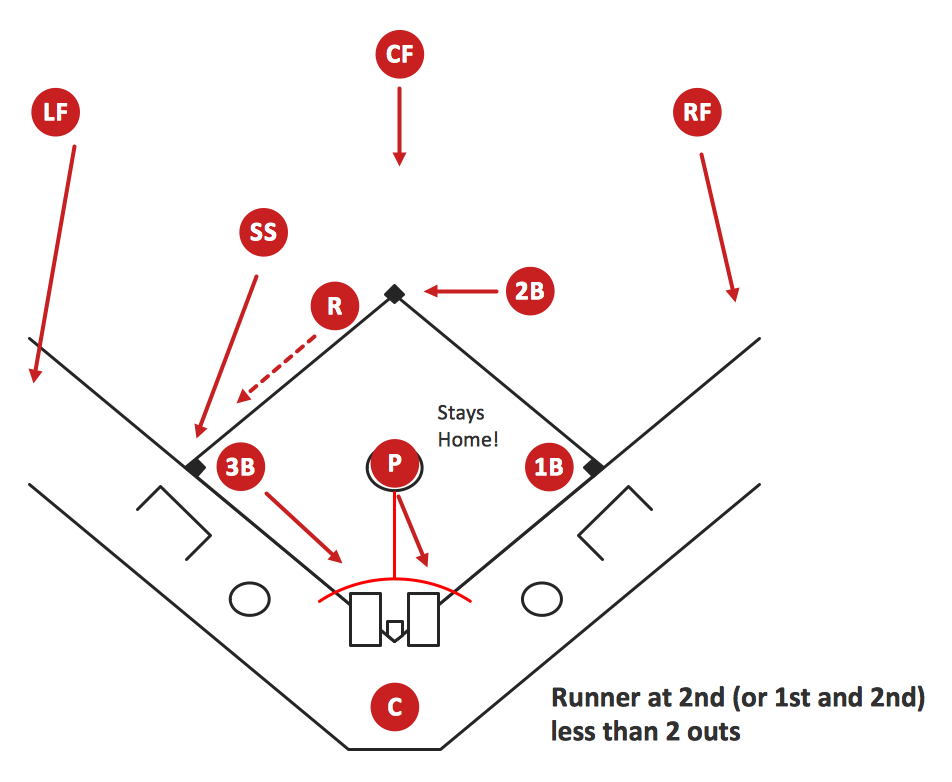
Baseball Diagram – Basic Bunt Coverage – Runner at 2nd
Basic Diagramming


 25 Typical Orgcharts
The 25 Typical Orgcharts solution contains powerful organizational structure and organizational management drawing tools, a variety of professionally designed organization chart and matrix organization structure samples, 25 templates based on various orga
Flow Chart Online

- Competitor Analysis | Block diagram - Porter's five forces model ...
- Draw A Diagram Of Porters Five Force Model Of Competitiveness In
- Competitor Analysis | Block diagram - Porter's five forces model ...
- Competitor Analysis | Block diagram - Porter's five forces model ...
- Block diagram - Porter's five forces model | Process Flowchart ...
- Diagram Of Generic Strategies
- Porter's Value Chain | Competitor Analysis | Block diagram - Porter's ...
- Block diagram - Porter's five forces model | Block Diagrams ...
- Five forces model - Template | Five forces model diagram ...
- Block diagram - Porter's five forces model
- Block diagram - Porter's five forces model | Target diagrams - Vector ...
- Block diagram - Porter's five forces model
- SWOT Analysis | SWOT analysis for a small independent bookstore ...
- Basketball Court Dimensions | Competitor Analysis | Block diagram ...
- Porter's generic strategies matrix diagram | Block diagram - Porter's ...
- Block diagram - Porter's five forces model | Competitor Analysis ...
- Block diagram - Porter's five forces model | Marketing Diagrams ...
- Porter's Value Chain | Block diagram - Porter's five forces model ...
- With The Aid Of Diagram Describe Three Areas That Service
- Block Diagram Of Market