Stakeholder Onion Diagrams

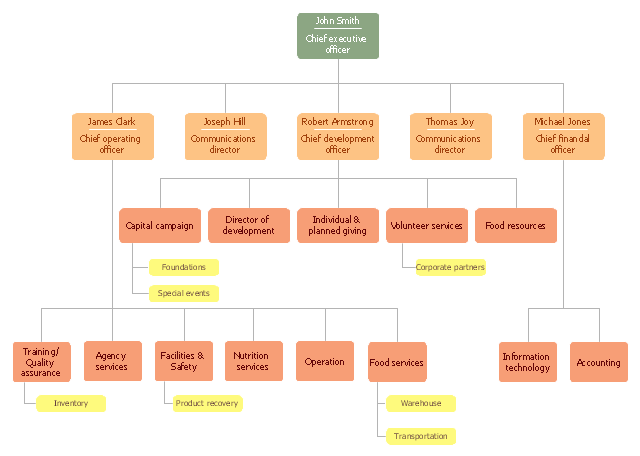
"A food bank or foodbank is a non-profit, charitable organization that distributes food to those who have difficulty purchasing enough food to avoid hunger.
In the United States and Australia, food banks usually operate on the "warehouse" model. They act as food storage and distribution depots for smaller front line agencies; and usually do not themselves give out food directly to the hungry. After the food is collected, sorted, and reviewed for quality, these food banks distribute it to non-profit community or government agencies, including food pantries, food closets, soup kitchens, homeless shelters, orphanages, and schools.
Outside North America and Australia, the "front line" model is often found. Such food banks give out most or all of their food directly to the end users. For both models, the largest sources of food include for-profit growers, manufacturers, distributors and retailers who in the normal course of business have excess food that they cannot sell. Some foodbanks receive a substantial proportion of their food from individual donors, including their volunteer workers. There is considerable overlap with food salvage, food rescue and gleaning, although not with freeganism or dumpster-diving." [Food bank. Wikipedia]
The organization chart example "Foodbank" was created using the ConceptDraw PRO diagramming and vector drawing software extended with the Organizational Charts solution from the Management area of ConceptDraw Solution Park.
Organizational chart
Functional Organizational Structure

Emergency Plan


 25 Typical Orgcharts
The 25 Typical Orgcharts solution contains powerful organizational structure and organizational management drawing tools, a variety of professionally designed organization chart and matrix organization structure samples, 25 templates based on various orga
How to Design a Good Workflow

Mind Map - Quality Structure

Cloud Computing Architecture Diagrams

Fundraising Pyramid


How to Present a Social Media Response Plan DFD to Your Team

Cloud Computing Architecture

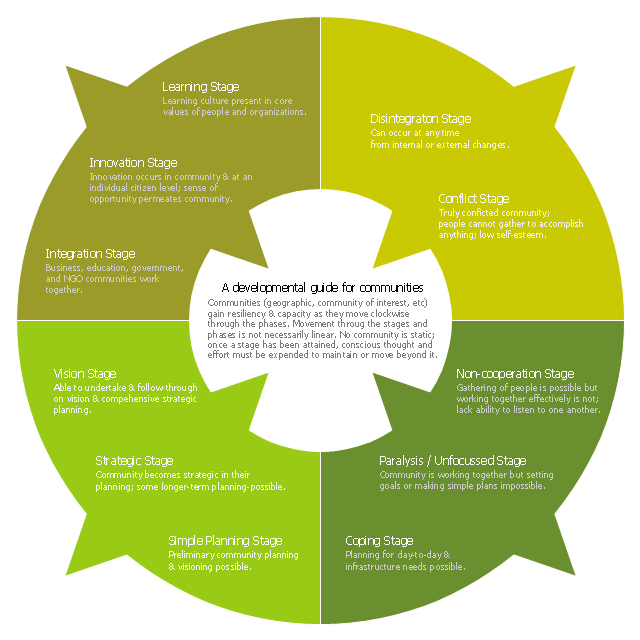
This ring chart sample was created on the base of the figure illustrating the "CCP Handbook - Comprehensive Community Planning for First Nations in British Columbia" from the Government of Canada website. "Tool 1: Centre for Innovative & Entrepreneurial Leadership (CIEL) Community Life Cycle Matrix.
Actualization Phase.
Community is highly developed and encourages learning & innovation while respecting history and culture. Community shares resources with others and regularly monitors itself, continuing to enhance capacity.
Action: Community undertakes regular reviews and reflection activities to maintain or enhance stage / phase.
Pre-Community or Chaos Phase.
Community is undeveloped. Limited sharing of resources or recognition of value of a community.
Action: Community can (re)form through the identification of and action of influential and respected leaders (elected or unelected).
Vision Phase.
Community recognizes the importance of vision and long-term planning; is able to move in this direction.
Action: Community can engage in planning, meaningful consultation of its members, & working towards the development of strategic thinking & planning, and, ultimately, identifying community-wide values, distinct community characteristics and a vision.
Emergence Phase.
Community exists but has significant problems, making anything but survival & fulfilling short-term needs impossible.
Action: Community can advance through focus on small, non-political, trustbuilding projects to build success, respect, confidence, relationships & skills.
Why the Matrix.
The challenge of developing innovative and entrepreneurial communities is in ensuring that the communities have a clear picture of where they are at and where they want to go. This enables a better match of the tools available with both the capacity of the community and the hoped for goal. For example, while strategic planning may work for some communities, the planning process may also lead to frustration and failure in other communities that do not have the necessary trust, social capital or capacity." [aadnc-aandc.gc.ca/ eng/ 1100100021972/ 1100100022090]
The ring chart example "Community life cycle matrix" was created using the ConceptDraw PRO diagramming and vector drawing software extended with the Target and Circular Diagrams solution from the Marketing area of ConceptDraw Solution Park.
www.conceptdraw.com/ solution-park/ marketing-target-and-circular-diagrams
Ring chart
Gantt Chart Templates

Pie Chart

Chart Templates

Donut Chart Templates

Network Topologies


- Matrix Organization Structure | How to Draw a Matrix Organizational ...
- 25 Typical Orgcharts | Community Newspaper Organogram
- Draw A Flow Chart Of An Organization Structure Of A Community
- Network Community Structure . Computer and Network Examples ...
- Organogram Of A Community Newspaper
- 25 Typical Orgcharts | Matrix Organization | Network Community ...
- 25 Typical Orgcharts | Matrix Organization | Matrix Organization ...
- Matrix Organization Structure | 25 Typical Orgcharts | TOWS Matrix ...
- Organization chart - Foodbank | Cooking Recipes | Organisational ...
- 25 Typical Orgcharts | Organogram For Security Company
- Fundraising pyramid diagram for community based cash donors ...
- Cloud Computing Architecture Diagrams | How to Create a Social ...
- Building Drawing Community Hall
- Health Centre Organogram
- Leadership and data | Organizational chart - University leadership ...
- Restaurant Floor Plans | Banquet Organisation Structure
- Data structure diagram with ConceptDraw PRO | Databases Access ...
- Pie Donut Chart . Pie Chart Examples | Competitor Analysis ...
- Organization chart - Foodbank | Organizational Charts | Create ...
- Pictorial Chart On School Community Relation