Pie Donut Chart. Pie Chart Examples

Competitor Analysis

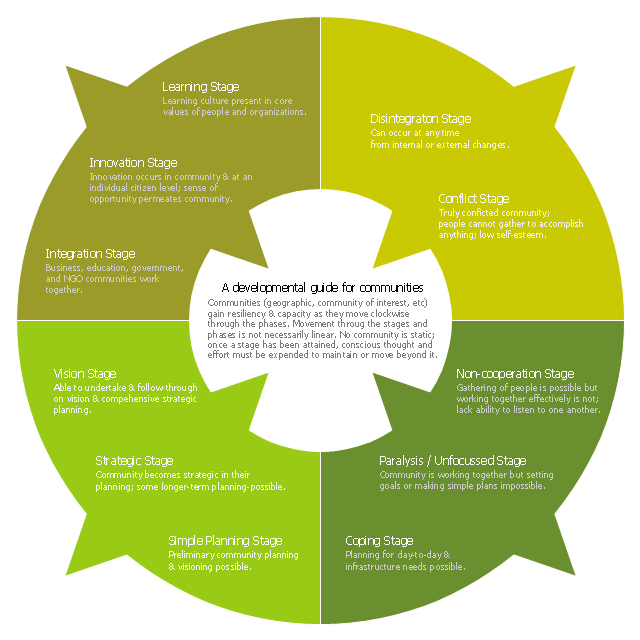
This ring chart sample was created on the base of the figure illustrating the "CCP Handbook - Comprehensive Community Planning for First Nations in British Columbia" from the Government of Canada website. "Tool 1: Centre for Innovative & Entrepreneurial Leadership (CIEL) Community Life Cycle Matrix.
Actualization Phase.
Community is highly developed and encourages learning & innovation while respecting history and culture. Community shares resources with others and regularly monitors itself, continuing to enhance capacity.
Action: Community undertakes regular reviews and reflection activities to maintain or enhance stage / phase.
Pre-Community or Chaos Phase.
Community is undeveloped. Limited sharing of resources or recognition of value of a community.
Action: Community can (re)form through the identification of and action of influential and respected leaders (elected or unelected).
Vision Phase.
Community recognizes the importance of vision and long-term planning; is able to move in this direction.
Action: Community can engage in planning, meaningful consultation of its members, & working towards the development of strategic thinking & planning, and, ultimately, identifying community-wide values, distinct community characteristics and a vision.
Emergence Phase.
Community exists but has significant problems, making anything but survival & fulfilling short-term needs impossible.
Action: Community can advance through focus on small, non-political, trustbuilding projects to build success, respect, confidence, relationships & skills.
Why the Matrix.
The challenge of developing innovative and entrepreneurial communities is in ensuring that the communities have a clear picture of where they are at and where they want to go. This enables a better match of the tools available with both the capacity of the community and the hoped for goal. For example, while strategic planning may work for some communities, the planning process may also lead to frustration and failure in other communities that do not have the necessary trust, social capital or capacity." [aadnc-aandc.gc.ca/ eng/ 1100100021972/ 1100100022090]
The ring chart example "Community life cycle matrix" was created using the ConceptDraw PRO diagramming and vector drawing software extended with the Target and Circular Diagrams solution from the Marketing area of ConceptDraw Solution Park.
www.conceptdraw.com/ solution-park/ marketing-target-and-circular-diagrams
Ring chart
Organizational Charts with ConceptDraw DIAGRAM

Organizational Chart Template

Rainfall Bar Chart

 25 Typical Orgcharts
The 25 Typical Orgcharts solution contains powerful organizational structure and organizational management drawing tools, a variety of professionally designed organization chart and matrix organization structure samples, 25 templates based on various orga
Pie Chart Examples and Templates

Pyramid Diagram and Pyramid Chart

 Basic Pie Charts
This solution extends the capabilities of ConceptDraw DIAGRAM (or later) with templates, samples, and a library of vector stencils for drawing pie and donut charts.
 Pie Charts
Pie Charts are extensively used in statistics and business for explaining data and work results, in mass media for comparison (i.e. to visualize the percentage for the parts of one total), and in many other fields. The Pie Charts solution for ConceptDraw DIAGRAM offers powerful drawing tools, varied templates, samples, and a library of vector stencils for simple construction and design of Pie Charts, Donut Chart, and Pie Graph Worksheets.
SWOT Matrix

Column Chart Template

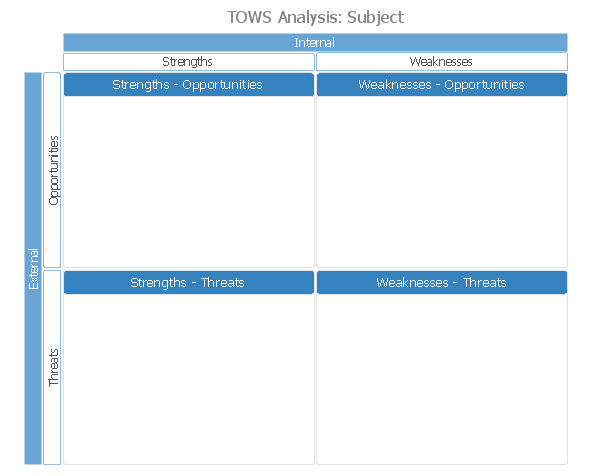
TOWS Analysis Software
How to Create a Pie Chart

- Pie Donut Chart. Pie Chart Examples | Competitor Analysis | SWOT ...
- Basic Diagramming | Community life cycle matrix - Ring chart | Pie ...
- Skill Matrix Pie Chart
- Application Of Matrix Pie Chart
- Process Flowchart | SWOT Matrix | Pie Donut Chart. Pie Chart ...
- Market Growth Share Matrix Pie Chart
- SWOT Analysis | SWOT analysis matrix diagram templates | Pie ...
- Pie Chart Software | Matrix Organization | Building Drawing Software ...
- Pie Chart Of Threats To The Environment
- Flowchart Software Free Download | Percentage Pie Chart . Pie ...
- Process Flowchart | How to Draw a Pie Chart Using ConceptDraw ...
- Matrices | Marketing | How to Draw a Pie Chart Using ConceptDraw ...
- Competitor Analysis | Bar Chart Template for Word | Pie Donut Chart ...
- Plumbing and Piping Plans | SWOT analysis matrix diagram ...
- Pie Chart Word Template. Pie Chart Examples | Venn Diagram ...
- Community life cycle matrix - Ring chart | Basic Diagramming | Use ...
- Ansoff Matrix | How to Make an Ansoff Matrix Template in ...
- Feature Comparison Chart Software | SWOT Matrix | Growth-Share ...
- Pie Chart Of Lifecycle
- Community life cycle matrix - Ring chart | Process Flowchart ...