Data Flow Diagram Software
When studying a business process or system that involves the transfer of data, it is common to use a data flow diagram (DFD) to visualize how that data is processed. While initially used exclusively in regards to the flow of data through a computer system, DFDs are now employed as a business modelling tool, describing business events and interactions, or physical systems involving data storage and transfer.ConceptDraw DIAGRAM is a powerful Data Flow Diagram Software thanks to the Data Flow Diagrams solution from the Software Development area of ConceptDraw Solution Park.
You can use the predesigned DFD vector objects that are grouped in 3 libraries of Data Flow Diagrams solution: Data Flow Diagrams Library; Gane-Sarson Notation Library; Yourdon and Coad Notation Library.
Data Flow Diagrams (DFD)
Data Flow Diagrams solution extends ConceptDraw DIAGRAM software with templates, samples and libraries of vector stencils for drawing the data flow diagrams (DFD).
Structured Systems Analysis and Design Method (SSADM) with ConceptDraw DIAGRAM
Structured Systems Analysis and Design Method SSADM is the method which is used at projecting and analysis of information systems. SSADM is based on the data flow diagrams. At the description of data flows out of the system and into the system DFD, which denote boundaries of the system, are used.Interaction Overview Diagram
UML Interaction Overview Diagram schematically shows a control flow with nodes and a sequence of activities that can contain interaction or sequence diagrams.
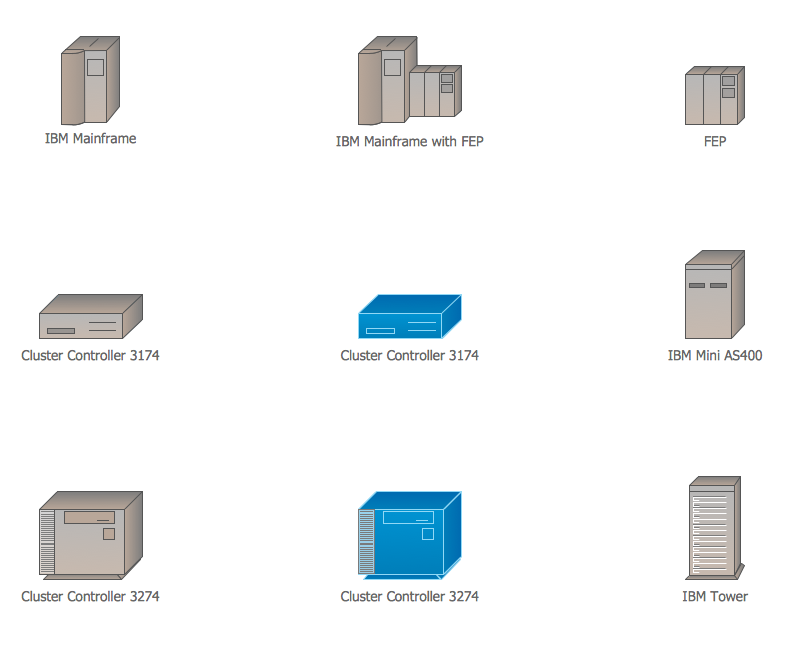
Cisco IBM. Cisco icons, shapes, stencils and symbols
The ConceptDraw vector stencils library Cisco IBM contains equipment symbols for drawing the computer network diagrams.How to Create Flowcharts for an Accounting Information System
Accounting information is a system of processes to represent financial and accounting data that is used by decision makers. To represent accounting processes there are special symbols which are used to create accounting flowcharts.Flowcharts help users of Accounting Information System to understand the step sequences of accounting processes. Use ConceptDraw DIAGRAM with Accounting Flowcharts solution to document and communicate visually how accounting processes work, and how each operation is done.
UML Use Case Diagram Example. Registration System
The use case diagram (behavior scenarios, precedents) is the initial conceptual representation of the system during its design and development. This diagram consists of actors, use cases and relationships between them. When constructing a diagram, common notation elements can also be used: notes and extension mechanisms.This sample was created in ConceptDraw DIAGRAM diagramming and vector drawing software using the UML Use Case Diagram library of the Rapid UML Solution from the Software Development area of ConceptDraw Solution Park.
This sample shows the types of user’s interactions with the system and is used at the registration and working with the database system.
UML Sample Project
Unified Modeling Language (UML) is a graphical modeling language for describing, visualizing, projecting and documenting of object oriented systems. UML digram is used for modeling of organizations and their business processes, for development the big projects, the complex software applications. Comprehensive UML diagram allows to create the set of interrelated documents that gives the complete visual representation of the modeling system.Fishbone Diagram Design Element
ConceptDraw DIAGRAM diagramming and vector drawing software extended with Fishbone Diagrams solution is a perfect tool for software designers and software developers. If you need to create Cause and Effect diagram, Fishbone diagram, Ishikawa diagram from templates and examples, or using the predesigned elements, ConceptDraw DIAGRAM can do this easily.ConceptDraw DIAGRAM software gives ability to design Fishbone diagrams that identify many possible causes for an effect for problem. Each Fishbone diagram design element included to Fishbone Diagrams library is vector and ready-to-use.
ConceptDraw Solution Park
ConceptDraw Solution Park collects graphic extensions, examples and learning materials
How to Present a Social Media Response Plan DFD to Your Team
Interactive tool helps you find the appropriate response to social media mentions quickly. There are materials to help trainers and consultants develop a social media strategy and provide training for social media groups on how to effectively accomplish their daily work.
Telecommunication Network Diagrams
Telecommunication Network Diagrams solution extends ConceptDraw DIAGRAM software with samples, templates, and great collection of vector stencils to help the specialists in a field of networks and telecommunications, as well as other users to create Computer systems networking and Telecommunication network diagrams for various fields, to organize the work of call centers, to design the GPRS networks and GPS navigational systems, mobile, satellite and hybrid communication networks, to construct the mobile TV networks and wireless broadband networks.
Fishbone Diagrams
The Fishbone Diagrams solution extends ConceptDraw DIAGRAM software with the ability to easily draw the Fishbone Diagrams (Ishikawa Diagrams) to clearly see the cause and effect analysis and also problem solving. The vector graphic diagrams produced using this solution can be used in whitepapers, presentations, datasheets, posters, and published technical material.
Business Process Diagrams
Business Process Diagrams solution extends the ConceptDraw DIAGRAM BPM software with RapidDraw interface, templates, samples and numerous libraries based on the BPMN 1.2 and BPMN 2.0 standards, which give you the possibility to visualize equally easy simple and complex processes, to design business models, to quickly develop and document in details any business processes on the stages of project’s planning and implementation.
- Download Data Flow Diagram School Management System
- Example Of Data Flow Diagram Of School Management System
- School Management Structure In A Flow Diagram
- Data Flow Diagram On School Management System On Yourdon
- School Management System Dfd
- Data Flow Diagram Of The School Library Management System
- School Management Systemproject Dfd In Pdf
- Data Flow Diagrams (DFD) | E R Diagram Of School Mangement
- School Management System Context Diagram
- Dfd Diagram School Management System Project
- Data Flow Diagrams | Table Seating Chart Template | Er Digram Of ...
- Data Flow Diagram For Library Information System In Schools
- Draw Data Flow Diagram For Library Management System
- State Diagram For School Management System
- Dfd For School Application Example
- Data Flow Diagram Of Billing System
- Design A Data Flow Diagram For A Mailing Sysytem In Your School
- School Management Diagram In Flowchart
- Dfd For School Management System Pdf
- School Management System Flowchart Diagram
- ERD | Entity Relationship Diagrams, ERD Software for Mac and Win
- Flowchart | Basic Flowchart Symbols and Meaning
- Flowchart | Flowchart Design - Symbols, Shapes, Stencils and Icons
- Flowchart | Flow Chart Symbols
- Electrical | Electrical Drawing - Wiring and Circuits Schematics
- Flowchart | Common Flowchart Symbols