Donut Chart Templates

All these donut chart templates are included in the Pie Charts solution.
You can quickly rework these examples into your own charts by simply changing displayed data, title and legend texts.
Pie Donut Chart. Pie Chart Examples

The Pie Donut Chart visualizes the percentage of parts of the whole and looks like as a ring divided into sectors. Pie Donut Charts are widely used in the business, statistics, analytics, mass media.
Pie Chart Software

ConceptDraw PRO software with Pie Charts solution helps to create pie and donut charts for effective displaying proportions in statistics, business and mass media for composition comparison, i.e. for visualization of part percentage inside one total.
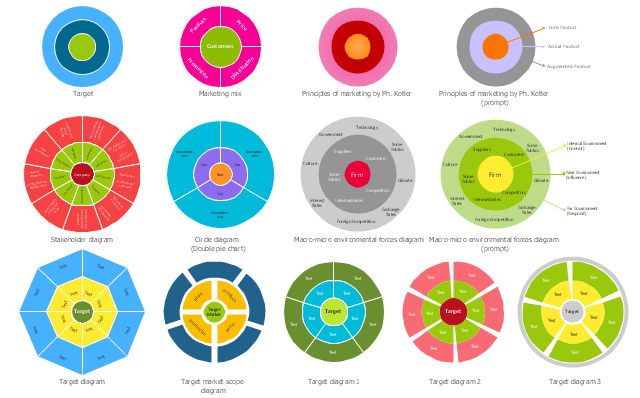
The vector stencils library "Target diagrams" contains 13 templates of target diagrams: marketing mix diagram, principles of marketing diagram, circle diagram, macro-micro environment diagram, stakeholder diagram, target market scope diagram.
The marketing diagrams templates example "Design elements - Target diagrams" for the ConceptDraw PRO diagramming and vector drawing software is included in the Target and Circular Diagrams solution from the Marketing area of ConceptDraw Solution Park.
www.conceptdraw.com/ solution-park/ marketing-target-and-circular-diagrams
Target diagrams templates
Pie Chart Examples and Templates

Chart Examples

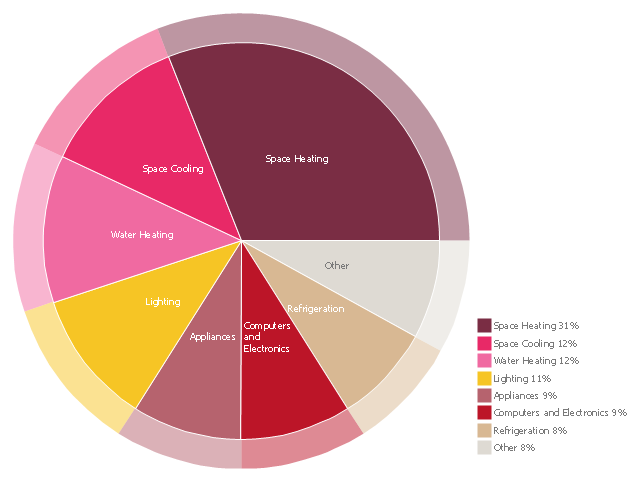
"Domestic energy consumption is the amount of energy that is spent on the various appliances used within housing. The amount of energy used per household varies widely depending on the standard of living of the country, climate, and the age and type of residence." [Domestic energy consumption. Wikipedia]
"A pie chart (or a circle graph) is a circular chart divided into sectors, illustrating numerical proportion. In a pie chart, the arc length of each sector (and consequently its central angle and area), is proportional to the quantity it represents. While it is named for its resemblance to a pie which has been sliced, there are variations on the way it can be presented. Pie charts are very widely used in the business world and the mass media." [Pie chart. Wikipedia]
This pie chart example "Domestic energy consumption" was created using the ConceptDraw PRO diagramming and vector drawing software extended with the Target and Circular Diagrams solution from the Marketing area of ConceptDraw Solution Park.
www.conceptdraw.com/ solution-park/ marketing-target-and-circular-diagrams
Pie chart
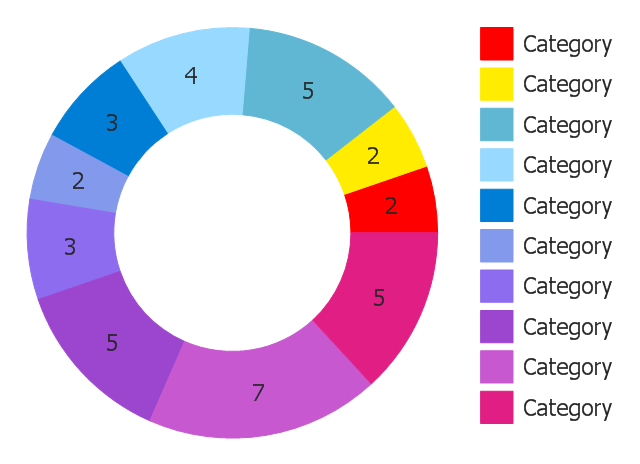
You can use this ring chart template in the ConceptDraw PRO diagramming and vector drawing software to add ring (doughnut, donut) charts to your websites, business documents, presentation slides and infographics.
"A doughnut chart (also spelled donut) is functionally identical to a pie chart, with the exception of a blank center and the ability to support multiple statistics as one." [Pie chart. Wikipedia]
The Ring chart template is included in the Pie Charts solution of the Graphs and Charts area in ConceptDraw Solution Park.
Ring chart template
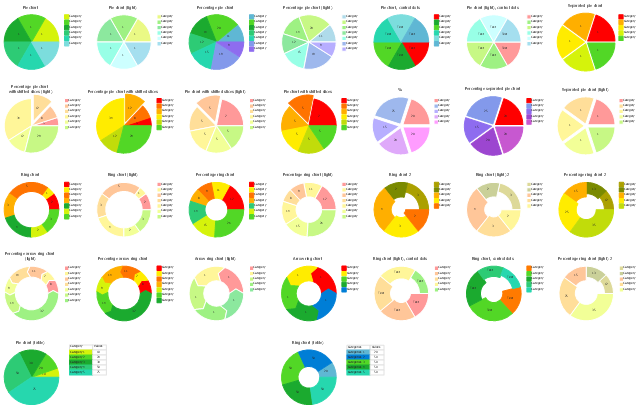
The vector stencils library Pie charts contains 28 templates you can use to add pie and donut charts in your business documents, presentation slides and infographics using the ConceptDraw PRO diagramming and vector drawing software.
"A pie chart (or a circle graph) is a circular chart divided into sectors, illustrating numerical proportion. In a pie chart, the arc length of each sector (and consequently its central angle and area), is proportional to the quantity it represents. While it is named for its resemblance to a pie which has been sliced, there are variations on the way it can be presented. ...
Pie charts are very widely used in the business world and the mass media. However, they have been criticized, and many experts recommend avoiding them, pointing out that research has shown it is difficult to compare different sections of a given pie chart, or to compare data across different pie charts. Pie charts can be replaced in most cases by other plots such as the bar chart. ...
However, if the goal is to compare a given category (a slice of the pie) with the total (the whole pie) in a single chart and the multiple is close to 25 or 50 percent, then a pie chart can often be more effective than a bar graph. ...
A doughnut chart (also spelled donut) is functionally identical to a pie chart, with the exception of a blank center and the ability to support multiple statistics as one." [Pie chart. Wikipedia]
The example "Design elements - Pie charts" is included in the Pie Charts solution of the Graphs and Charts area in ConceptDraw Solution Park.
Pie chart and donut chart templates
Use this template of arrow circle chart (circle arrow diagram, segmented cycle diagram) in the ConceptDraw PRO diagramming and vector drawing software to visualize progression or continuing sequence of stages, tasks or events as circular flow.
The Arrow circle chart template is included in the Pie Charts solution of the Graphs and Charts area in ConceptDraw Solution Park.
The Arrow circle chart template is included in the Pie Charts solution of the Graphs and Charts area in ConceptDraw Solution Park.
Circle arrow diagram
Pie Chart Word Template. Pie Chart Examples

Percentage Pie Chart. Pie Chart Examples

This sample shows the Pie Chart of the approximate air composition. You can see the percentage of oxygen, nitrogen and other gases in the air visualized on this Pie Chart.
Line Chart Examples

Line Chart Template for Word

This sample shows the Line Chart of annual percentage change. The Line Chart allows you to clearly see the changes of data over the time.
Bar Chart Examples

 Pie Charts
Pie Charts solution extends ConceptDraw PRO software with templates, samples and library of vector stencils for drawing the pie and donut charts.
Scatter Chart Examples

Use it to draw scatter graphs using ConceptDraw PRO diagramming and vector drawing software for illustrating your documents, presentations and websites.
Column Chart Examples

Basic Diagramming


Line Graph Charting Software

- Pie Chart Software | Pie Chart Examples and Templates | Donut ...
- Donut chart template
- Donut chart template | Doughnut chart template | Ring chart template |
- Pie Chart Software | Pie Chart Examples and Templates | Pie Donut ...
- Pie Chart Examples and Templates | Chart Examples | Donut Chart ...
- Ring chart template | Pie Chart Examples and Templates | Design ...
- Pie Chart Software | Pie Chart Examples and Templates | Pie Donut ...
- Pie chart template
- Pie Charts | Create Graphs and Charts | LLNL Flow Charts |
- Percentage Pie Chart . Pie Chart Examples
- Pie Charts | Pie Chart Examples and Templates | Pie Chart Software |
- Pie chart template
- Pie Chart Examples | Pie Chart Software | Basic Diagramming |
- Arrow circle chart template | Arrow pie chart template | Basic ...
- Pie chart template - Conceptdraw.com
- Blank Scatter Plot | Donut Chart Templates | Pie Chart Examples ...
- Arrow circle chart template | Circular arrows diagram - PDCA cycle ...
- How to Create a Pie Chart | Pie Chart Software | Pie Chart Examples |
- Pie Chart Examples and Templates | Bar Diagrams for Problem ...
- Pie Chart Examples and Templates | How to Create a Pie Chart | Pie ...