Pyramid Diagram

Pyramid Diagram

Project — Working With Costs

CORRECTIVE ACTIONS PLANNING. PERT Chart


ConceptDraw PROJECT Project Management Software Tool

 Timeline Diagrams
Timeline Diagrams solution extends ConceptDraw PRO software with templates, samples and library of vector stencils for drawing the timeline and milestones diagrams.
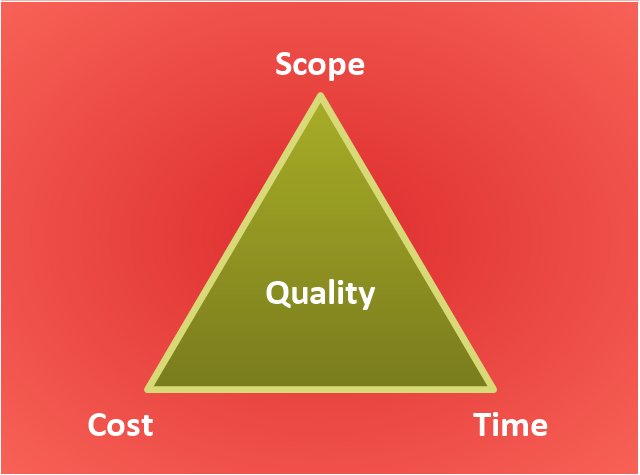
"The Project Management Triangle (called also Triple Constraint or the Iron Triangle) is a model of the constraints of project management. It is a graphic aid where the three attributes show on the corners of the triangle to show opposition. It is useful to help with intentionally choosing project biases, or analyzing the goals of a project. It is used to illustrate that project management success is measured by the project team's ability to manage the project, so that the expected results are produced while managing time and cost." [Project management triangle. Wikipedia]
The pyramid chart example "Project management triangle diagram" was redesigned using the ConceptDraw PRO diagramming and vector drawing software from Wikimedia Commons file Project-triangle-en.svg. [commons.wikimedia.org/ wiki/ File:Project-triangle-en.svg]
The project management triangle chart example is included in the Pyramid Diagrams solution from the Marketing area of ConceptDraw Solution Park.
Pyramid diagram
 PM Teams
This solution extends ConceptDraw Office 2.0 products with a single information space for messaging to teams.
 PM Response
This solution extends all ConceptDraw Office 2.0 products by helping to improve the response time to project changes. PM Response also helps with iteration planning, discussing project layout approaches, and solving project challenges.
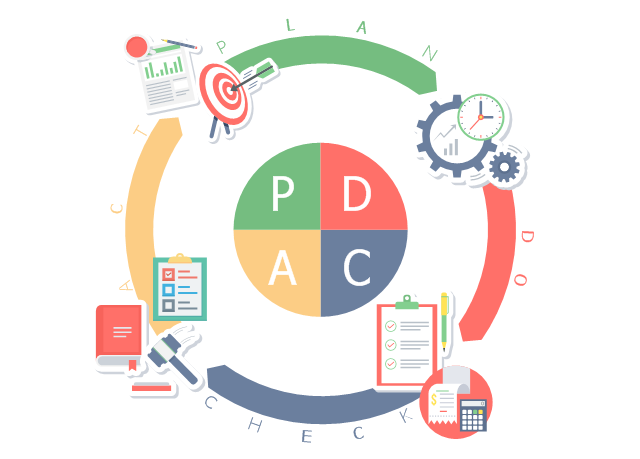
This business infographic sample shows the plan–do–check–act cycle. It was designed on the base of the Wikimedia Commons file: PDCA-Cycle.png.
[commons.wikimedia.org/ wiki/ File:PDCA-Cycle.png]
This file is licensed under the Creative Commons Attribution-Share Alike 3.0 Unported license. [creativecommons.org/ licenses/ by-sa/ 3.0/ deed.en]
"PDCA (plan–do–check–act or plan–do–check–adjust) is an iterative four-step management method used in business for the control and continual improvement of processes and products. It is also known as the Deming circle/ cycle/ wheel, Shewhart cycle, control circle/ cycle, or plan–do–study–act (PDSA)." [PDCA. Wikipedia]
The business infographic example "PDCA cycle" was designed using ConceptDraw PRO diagramming and vector drawing software extended with the Business and Finance solution from Illustration area of ConceptDraw Solution Park.
Infographic
How To Plan and Implement Projects Faster

Gant Chart in Project Management


Software development with ConceptDraw Products

 PM Docs
This solution extends ConceptDraw MINDMAP software with the ability to organize project and company documentation and structure information that relates to your project.
Product Overview

 PM Presentations
This solution extends ConceptDraw MINDMAP and ConceptDraw PRO software, improving the efficiency of the project management process by using the same source data to build targeted presentations.
Gantt charts for planning and scheduling projects

 PM Easy
This solution extends ConceptDraw PROJECT software with the ability to quickly start a project; it lists task relationships and dependencies to make iterative planning easy.
- Gant Chart in Project Management | Project Working With Costs ...
- Pyramid Diagram | Project management triangle diagram | Pyramid ...
- Project management diagram
- CORRECTIVE ACTIONS PLANNING PERT Chart | How To ...
- Audit flowchart - Project management process | Good Flow Chart ...
- Pyramid Diagram | Simple & Fast Diagram Software | PM Response |
- Audit flowchart - Project management process | Cross-Functional ...
- Pyramid Diagram | Gantt charts for planning and scheduling projects ...
- How To Implement Collaborative Project Management | How To Use ...
- Project Assigning Resources | How To Implement Collaborative ...
- PM Teams | Pyramid Diagram | PM Response |
- How to Draw an Organization Chart | Gant Chart in Project ...
- Audit flowchart - Project management process | PM Presentations ...
- Project timeline diagram
- Pyramid Diagram | Diagram Flow Chart | How To Plan and ...
- Conceptdraw.com: Mind Map Software, Drawing Tools | Project ...
- Gant Chart in Project Management | What Constitutes a Project ...
- Social Media Response Management Charts - software tools ...
- Gant Chart in Project Management
- Gant Chart in Project Management | Project Working With Costs ...