Process Flowchart


Pyramid Diagram and Pyramid Chart

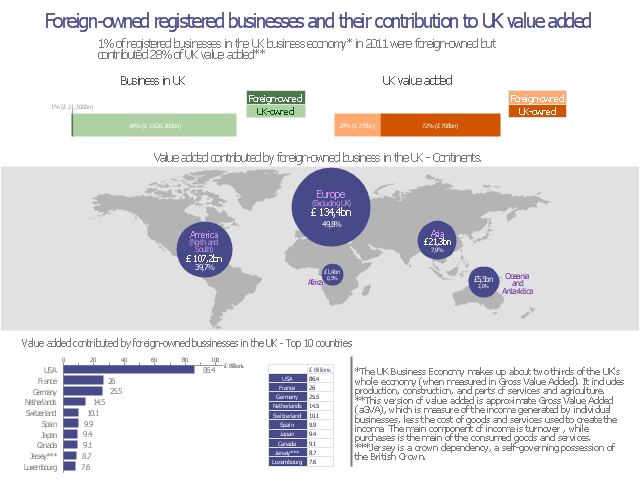
This data-driven infographics example was redesigned from the Wikimedia Commons file: Foreign-owned registered businesses and their contribution to UK value added.png.
"A snapshot of ONS’s Annual Business Survey (ABS) to look at the contribution that foreign-owned registered businesses (20.9 Kb Pdf) in the UK make to the UK Business Economy, and their country of ownership." [commons.wikimedia.org/ wiki/ File:Foreign-owned_ registered_ businesses_ and_ their_ contribution_ to_ UK_ value_ added.png]
The divided bar diagram and bar chart example "Value added contributed by foreign-owned" was created using the ConceptDraw PRO diagramming and vector graphics software extended with the Data-driven Infographics" solution from the area "What is infographics" of ConceptDraw Solution Park.
Data-driven infographics
Used Solutions
How to Create a Pyramid Diagram

"The Process Flow Chart provides a visual representation of the steps in a process. ...
When to Use:
One of the first activities of a process improvement effort is constructing a flowchart. It provides the following benefits:
1- It give you and everyone a clear understanding of the process.
2- Facilitates teamwork and communication.
3- Helps to identify non-value-added operations."
[bexcellence.org/ Flow-Chart.html]
This TQM diagram example shows a business process that can be then analyzed to improve the effectiveness and diagnose quality issues that require resolution.
This example was created using the ConceptDraw PRO diagramming and vector drawing software extended with the Total Quality Management (TQM) Diagrams solution from the Quality area of ConceptDraw Solution Park.
TQM diagram

Relative Value Chart Software

Basic Flowchart Symbols and Meaning


Value stream with ConceptDraw PRO

"Value Stream Map (VSM)
1. A tool used to improve a process by identifying added value and eliminating waste.
2. A process map that follows the value creation process.
A. “strap yourself to the product (or service) and see where you go”
3. A process map with data added.
A. Times: processing, wait, cycle.
B. Quality: number of rejects.
C. Inventory.
D. Resources.
1) Number of people.
2) Space.
3) Distance traveled.
E. Whatever else is useful for analyzing the process." [ocw.mit.edu/ courses/ aeronautics-and-astronautics/ 16-660j-introduction-to-lean-six-sigma-methods-january-iap-2012/ lecture-notes/ MIT16_ 660JIAP12_ 1-6.pdf]
This sample VSM flowchart shows the value stream in a manufacturing, production control and shipping processes.
This value stream mapping diagram example was created using the ConceptDraw PRO diagramming and vector drawing software extended with the Value Stream Mapping solution from the Quality area of ConceptDraw Solution Park.
Value stream mapping

Cross-Functional Flowchart


Types of Flowchart - Overview


Basic Flowchart Examples

Basic Audit Flowchart. Flowchart Examples

Total Quality Management Value

Samples of Flowchart

- Value Added Chain Diagram
- Make A Diagram To Explain The Meaning Of Value Added
- Value Added Process Mapping
- Porter's value chain matrix diagram
- Value Added Network Diagram
- Make Diagram To Explain Value Added
- Explain Value Added Network By Digram
- A Diagram Explaining Value Added
- A Diagram Showing Value Added
- Diagram Explaining The Meaning Of Value Added
- Value added contributed by foreign-owned | Glyph icons - Vector ...
- Total Quality Management Value | Organizational Structure Total ...
- Competitor Analysis | Porter's Value Chain | Business Productivity ...
- Marketing Matrix Diagram Porters Value Chain
- Value added contributed by foreign-owned | Chart Examples ...
- Value stream map parts
- Value added contributed by foreign-owned | Marketing infogram 3 ...
- TQM Diagram Example | Total Quality Management TQM Diagrams ...
- Value Added Industry Vector Png
- Value stream mapping diagram