"A value chain is a chain of activities that a firm operating in a specific industry performs in order to deliver a valuable product or service for the market. ...
The concept of value chains as decision support tools, was added onto the competitive strategies paradigm developed by Porter as early as 1979. In Porter's value chains, Inbound Logistics, Operations, Outbound Logistics, Marketing and Sales and Service are categorized as primary activities. Secondary activities include Procurement, Human Resource management, Technological Development and Infrastructure." [Value chain. Wikipedia]
This Porter's value chain matrix diagram example was created using the ConceptDraw PRO diagramming and vector drawing software extended with the Matrices solution from the Marketing area of ConceptDraw Solution Park.
Porter's value chain matrix

 Event-driven Process Chain Diagrams
Event-Driven Process Chain Diagrams solution extends ConceptDraw DIAGRAM functionality with event driven process chain templates, samples of EPC engineering and modeling the business processes, and a vector shape library for drawing the EPC diagrams and EPC flowcharts of any complexity. It is one of EPC IT solutions that assist the marketing experts, business specialists, engineers, educators and researchers in resources planning and improving the business processes using the EPC flowchart or EPC diagram. Use the EPC solutions tools to construct the chain of events and functions, to illustrate the structure of a business process control flow, to describe people and tasks for execution the business processes, to identify the inefficient businesses processes and measures required to make them efficient.
Porter's Value Chain

Process Flowchart


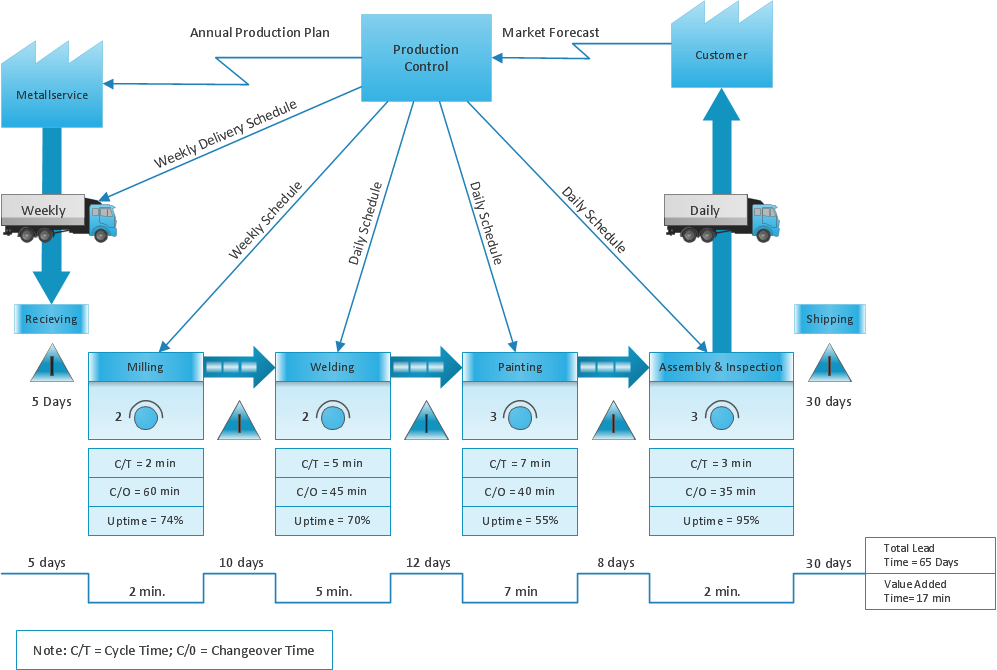
Best Value Stream Mapping mac Software

 Basic EPC Diagrams
The Event-driven Process Chain Diagrams solution extends ConceptDraw DIAGRAM software with EPC templates, samples, and vector shape library for the drawing of EPC diagrams.
HelpDesk
Event-driven Process Chain (EPC) Diagram Software

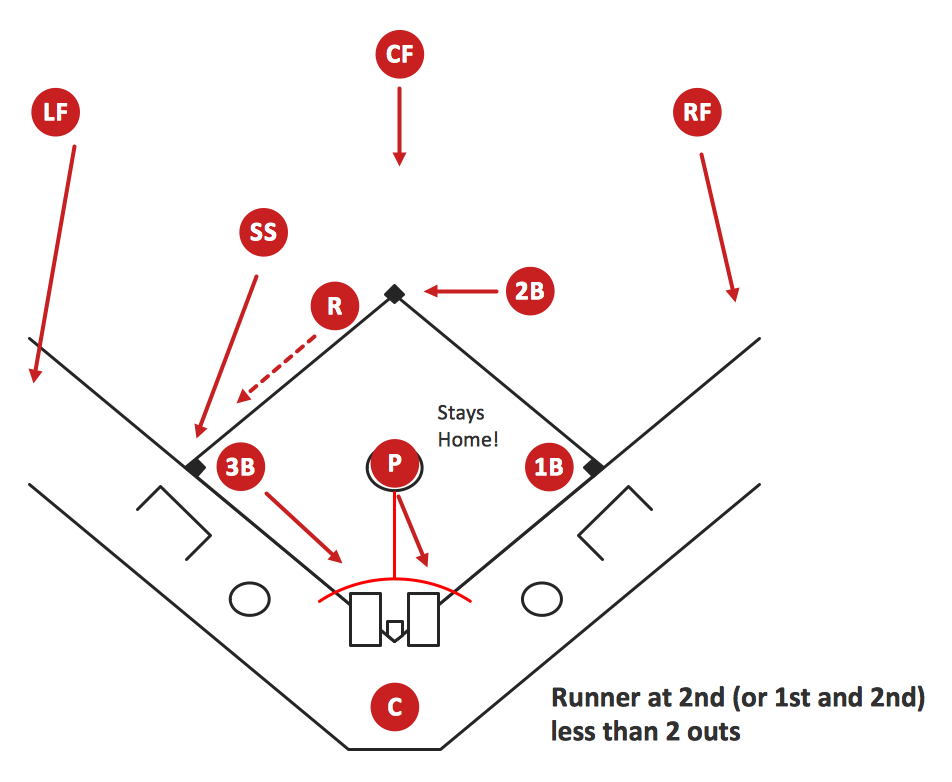
Baseball Diagram – Basic Bunt Coverage – Runner at 2nd
The Lean Enterprise Value Stream Mapping
How to Draw a Flowchart

- Porter's value chain matrix diagram
- Make Diagram To Explain Value Added
- Porter's value chain diagram
- Porter's Value Chain | Process Flowchart | Logistics Flow Charts ...
- Porter's value chain matrix diagram | Design elements - Matrices ...
- Porter's value chain matrix diagram | Matrices | Value Chain ...
- Explain Value Added Network By Digram
- Porter's value chain diagram - Template | Porter's value chain matrix ...
- Porter's value chain diagram - Template | Block diagram - Porter's ...