UML Class Diagram Example for Transport System

UML Class Diagram Example for GoodsTransportation System

Rail transport - Design elements

Road Transport - Design Elements

 Fishbone Diagram
Fishbone Diagrams solution extends ConceptDraw PRO software with templates, samples and library of vector stencils for drawing the Ishikawa diagrams for cause and effect analysis.
UML Class Diagram Generalization Example UML Diagrams

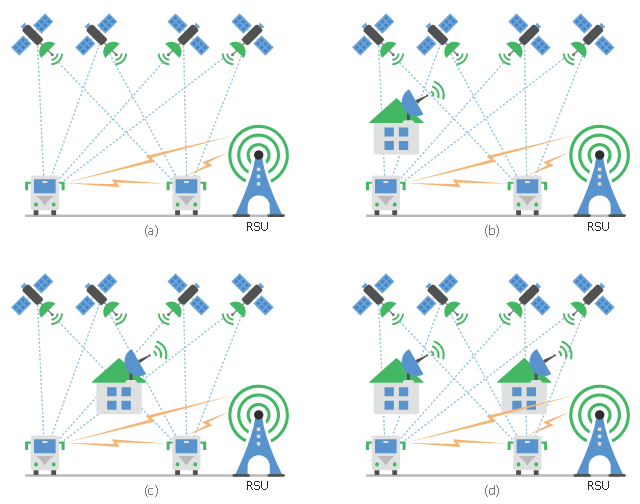
This diagram sample shows the different situations that cooperative positioning may be helpful for vehicular networks. It was designed on the base of Wikimedia Commons file: CPsituations.jpg.
[commons.wikimedia.org/ wiki/ File:CPsituations.jpg]
"Vehicular Ad Hoc Networks (VANETs) are created by applying the principles of mobile ad hoc networks (MANETs) - the spontaneous creation of a wireless network for data exchange - to the domain of vehicles. They are a key component of intelligent transportation systems (ITS).
While, in the early 2000s, VANETs were seen as a mere one-to-one application of MANET principles, they have since then developed into a field of research in their own right. By 2015, the term VANET became mostly synonymous with the more generic term inter-vehicle communication (IVC), although the focus remains on the aspect of spontaneous networking, much less on the use of infrastructure like Road Side Units (RSUs) or cellular networks." [Vehicular ad hoc network. Wikipedia]
The vehicular network diagram example "CP situations" was created using the ConceptDraw PRO diagramming and vector drawing software extended with the Computers and Communications solution from the Illustration area of ConceptDraw Solution Park.
Telecommunication diagram
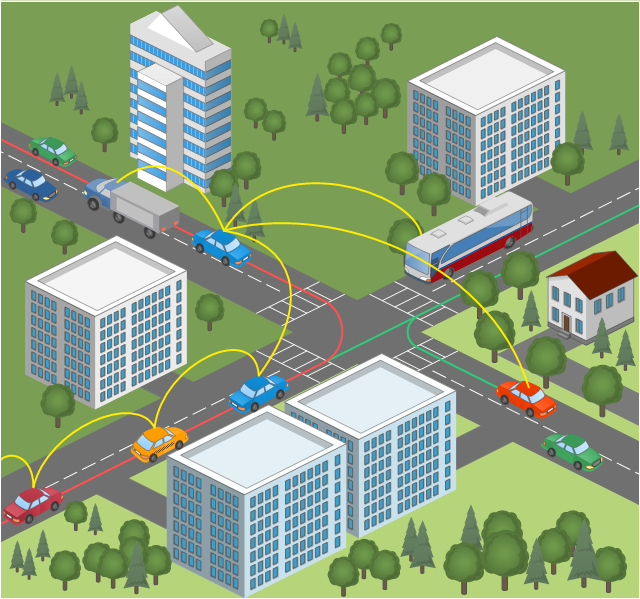
This vehicular network diagram sample was drawn on the base of picture illustrating the post "Intelligent transportation system" from the blog "Technology New Here".
"Intelligent transportation systems are projects that aim to integrate modern communication and information technology into existing transportation management systems in order to optimize vehicle life, fuel efficiency, safety, and traffic in urbanized cities.
The need for intelligent transportation systems stems from the fact that traffic congestion has been increasing all around the world because of increasing population, increasing amount of transportation vehicles and increasing urbanization."
[technologynewhere.wordpress.com/ 2010/ 05/ 12/ intelligent-transportation-system/ ]
The vehicular network diagram example "Intelligent transportation system" was created using the ConceptDraw PRO diagramming and vector drawing software extended with the Vehicular Networking solution from the Computer and Networks area of ConceptDraw Solution Park.
Vehicular network diagram
Used Solutions
UML Use Case Diagram. Design Elements
")

UML Class Diagram Example - Apartment Plan

UML Use Case Diagram Example Registration System

Use the Best FlowChart Tool for the Job

Timing diagram

Basic Flowchart Symbols and Meaning


"The Process Flow Chart provides a visual representation of the steps in a process. ...
When to Use:
One of the first activities of a process improvement effort is constructing a flowchart. It provides the following benefits:
1- It give you and everyone a clear understanding of the process.
2- Facilitates teamwork and communication.
3- Helps to identify non-value-added operations."
[bexcellence.org/ Flow-Chart.html]
This TQM diagram example shows a business process that can be then analyzed to improve the effectiveness and diagnose quality issues that require resolution.
This example was created using the ConceptDraw PRO diagramming and vector drawing software extended with the Total Quality Management (TQM) Diagrams solution from the Quality area of ConceptDraw Solution Park.
TQM diagram

- Analysis Of Transport And Communication With Graph And Diagram
- Means Of Transport And Communication Easy Chart Drawing
- Diagram On Transportation And Communication
- Simple Diagram Transportation And Communication
- What Are Diagram Transport Communication
- Diagram Of Transport And Communication
- Transport And Communication Diagram On Chart
- Easy Drawing On Transport And Communication
- Transportation Infographics | Intelligent transportation system | UML ...
- Intelligent transportation system | Wireless Network Diagram ...
- Aerospace and Transport | Telecommunication Network Diagrams ...
- Transport And Communication
- Visible light communication | Road Transport - Design Elements ...
- Computer and Networks Area | Road Transport - Design Elements ...
- Independent regional networks diagram | Inter-vehicle ...
- Inter-vehicle communication systems | Vehicular Networking ...
- Visible light communication | Vehicular ad-hoc network | Road ...
- Intelligent transportation system | Global vehicular network diagram ...
- Visible light communication | Design elements - Local vehicular ...
- Diagramming Software for Design UML Communication Diagrams ...