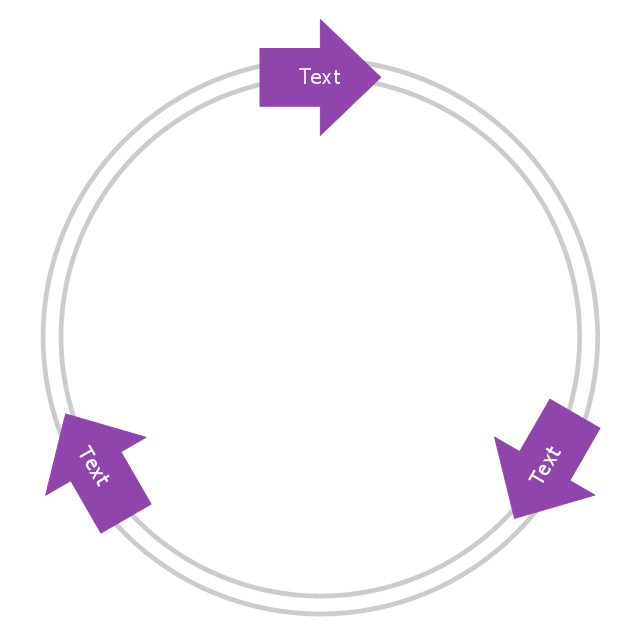
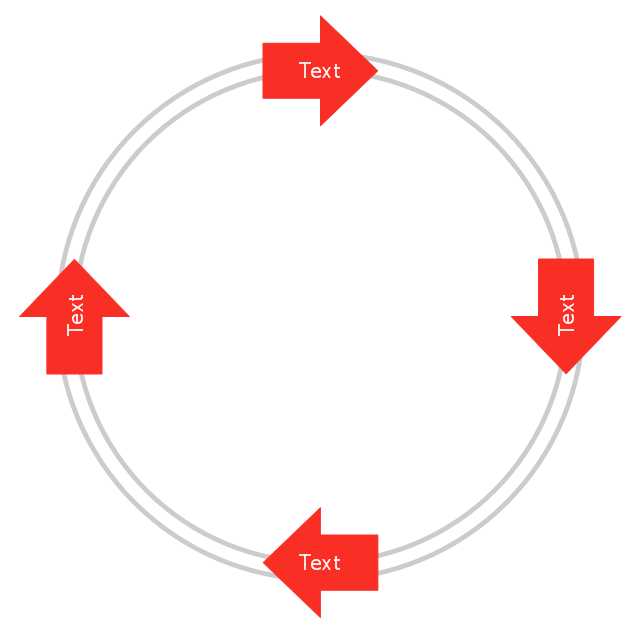
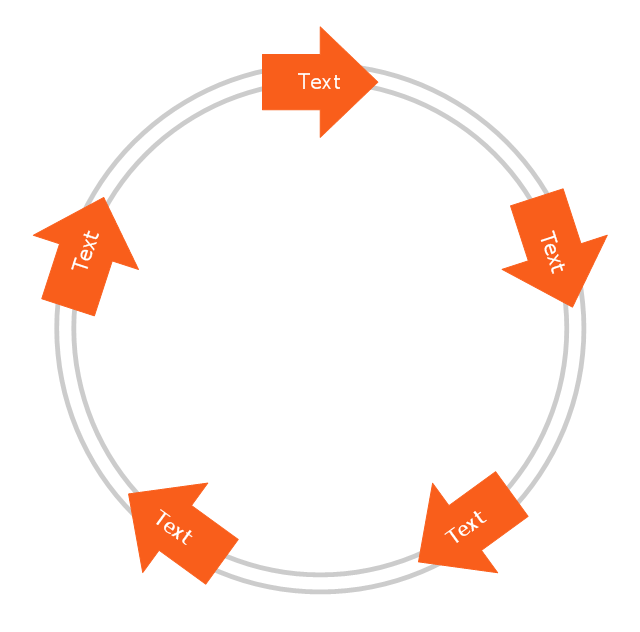
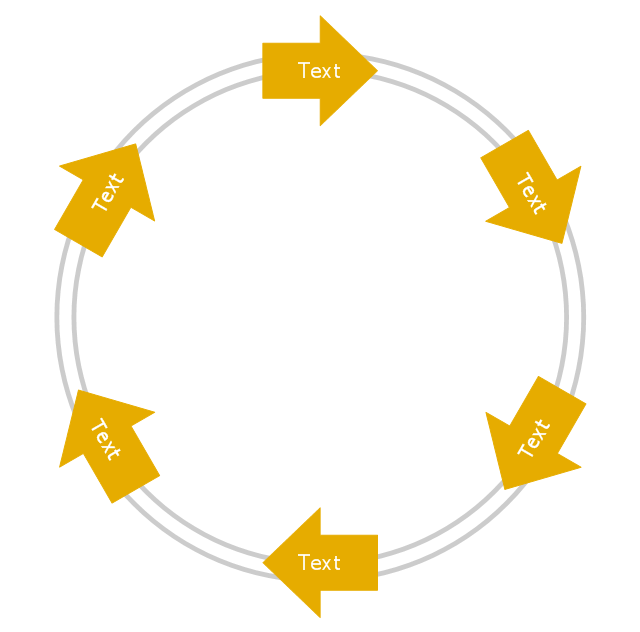
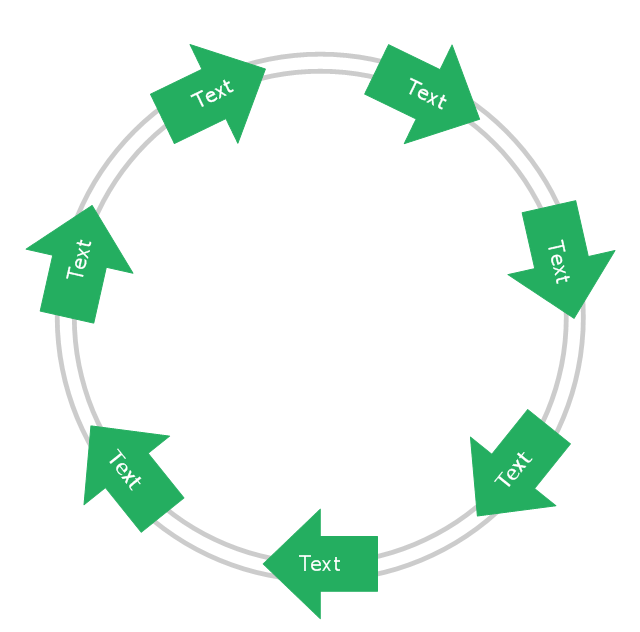
The vector stencils library "Circular arrows diagrams" contains 20 templates of circular arrows diagrams and arrow donut charts.
Use these shapes to draw your circular arrows diagrams in the ConceptDraw PRO diagramming and vector drawing software.
The vector stencils library "Circular arrows diagrams" is included in the Circular Arrows Diagrams solution from the area "What is a Diagram" of ConceptDraw Solution Park.
Use these shapes to draw your circular arrows diagrams in the ConceptDraw PRO diagramming and vector drawing software.
The vector stencils library "Circular arrows diagrams" is included in the Circular Arrows Diagrams solution from the area "What is a Diagram" of ConceptDraw Solution Park.
Sales Process Flowchart Symbols
The most easier way of creating the visually engaging and informative Sales Process Flowchart is to create the new ConceptDraw document and to use the predesigned vector symbols offered in 6 libraries of the Sales Flowchart Solution. There are more than six types of sales process flow diagrams, ConceptDraw PRO software is flowchart maker which include six collections of extended flowchart symbols for effective diagramming. There are main collections of color coded flowchart symbols: Sales Department, Sales Steps, Sales Workflow, Sales Symbols and special set of Sales Arrows and Sales Flowchart.
 Venn Diagrams
Venn Diagrams are actively used to illustrate simple set relationships in set theory and probability theory, logic and statistics, mathematics and computer science, linguistics, sociology, and marketing. Venn Diagrams are also often used to visually summarize the status and future viability of a project.
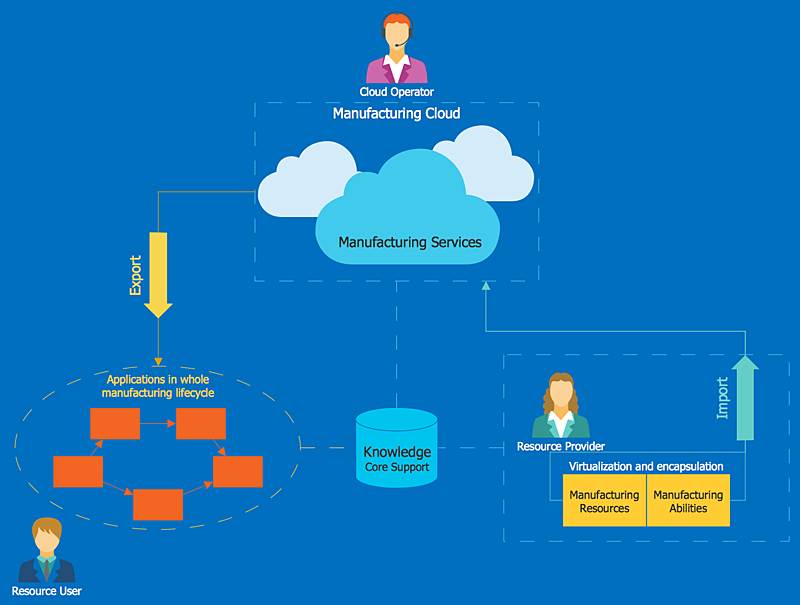
How to Build Cloud Computing Diagram Principal Cloud Manufacturing
The term “cloud” is very popular and widely used now, it is a server, data processing centre, or a network which lets to store the data and software, provides access to them, allows to run applications without installation and gives the possibility to process data hosted remotely via the Internet connection. For documenting the Cloud Computing Architecture with a goal to facilitate the communication between stakeholders are successfully used the Cloud Computing Architecture diagrams. It is convenient and easy to draw various Cloud Computing Architecture diagrams in ConceptDraw PRO software with help of tools of the Cloud Computing Diagrams Solution from the Computer and Networks Area of ConceptDraw Solution Park.Electrical Diagram Software
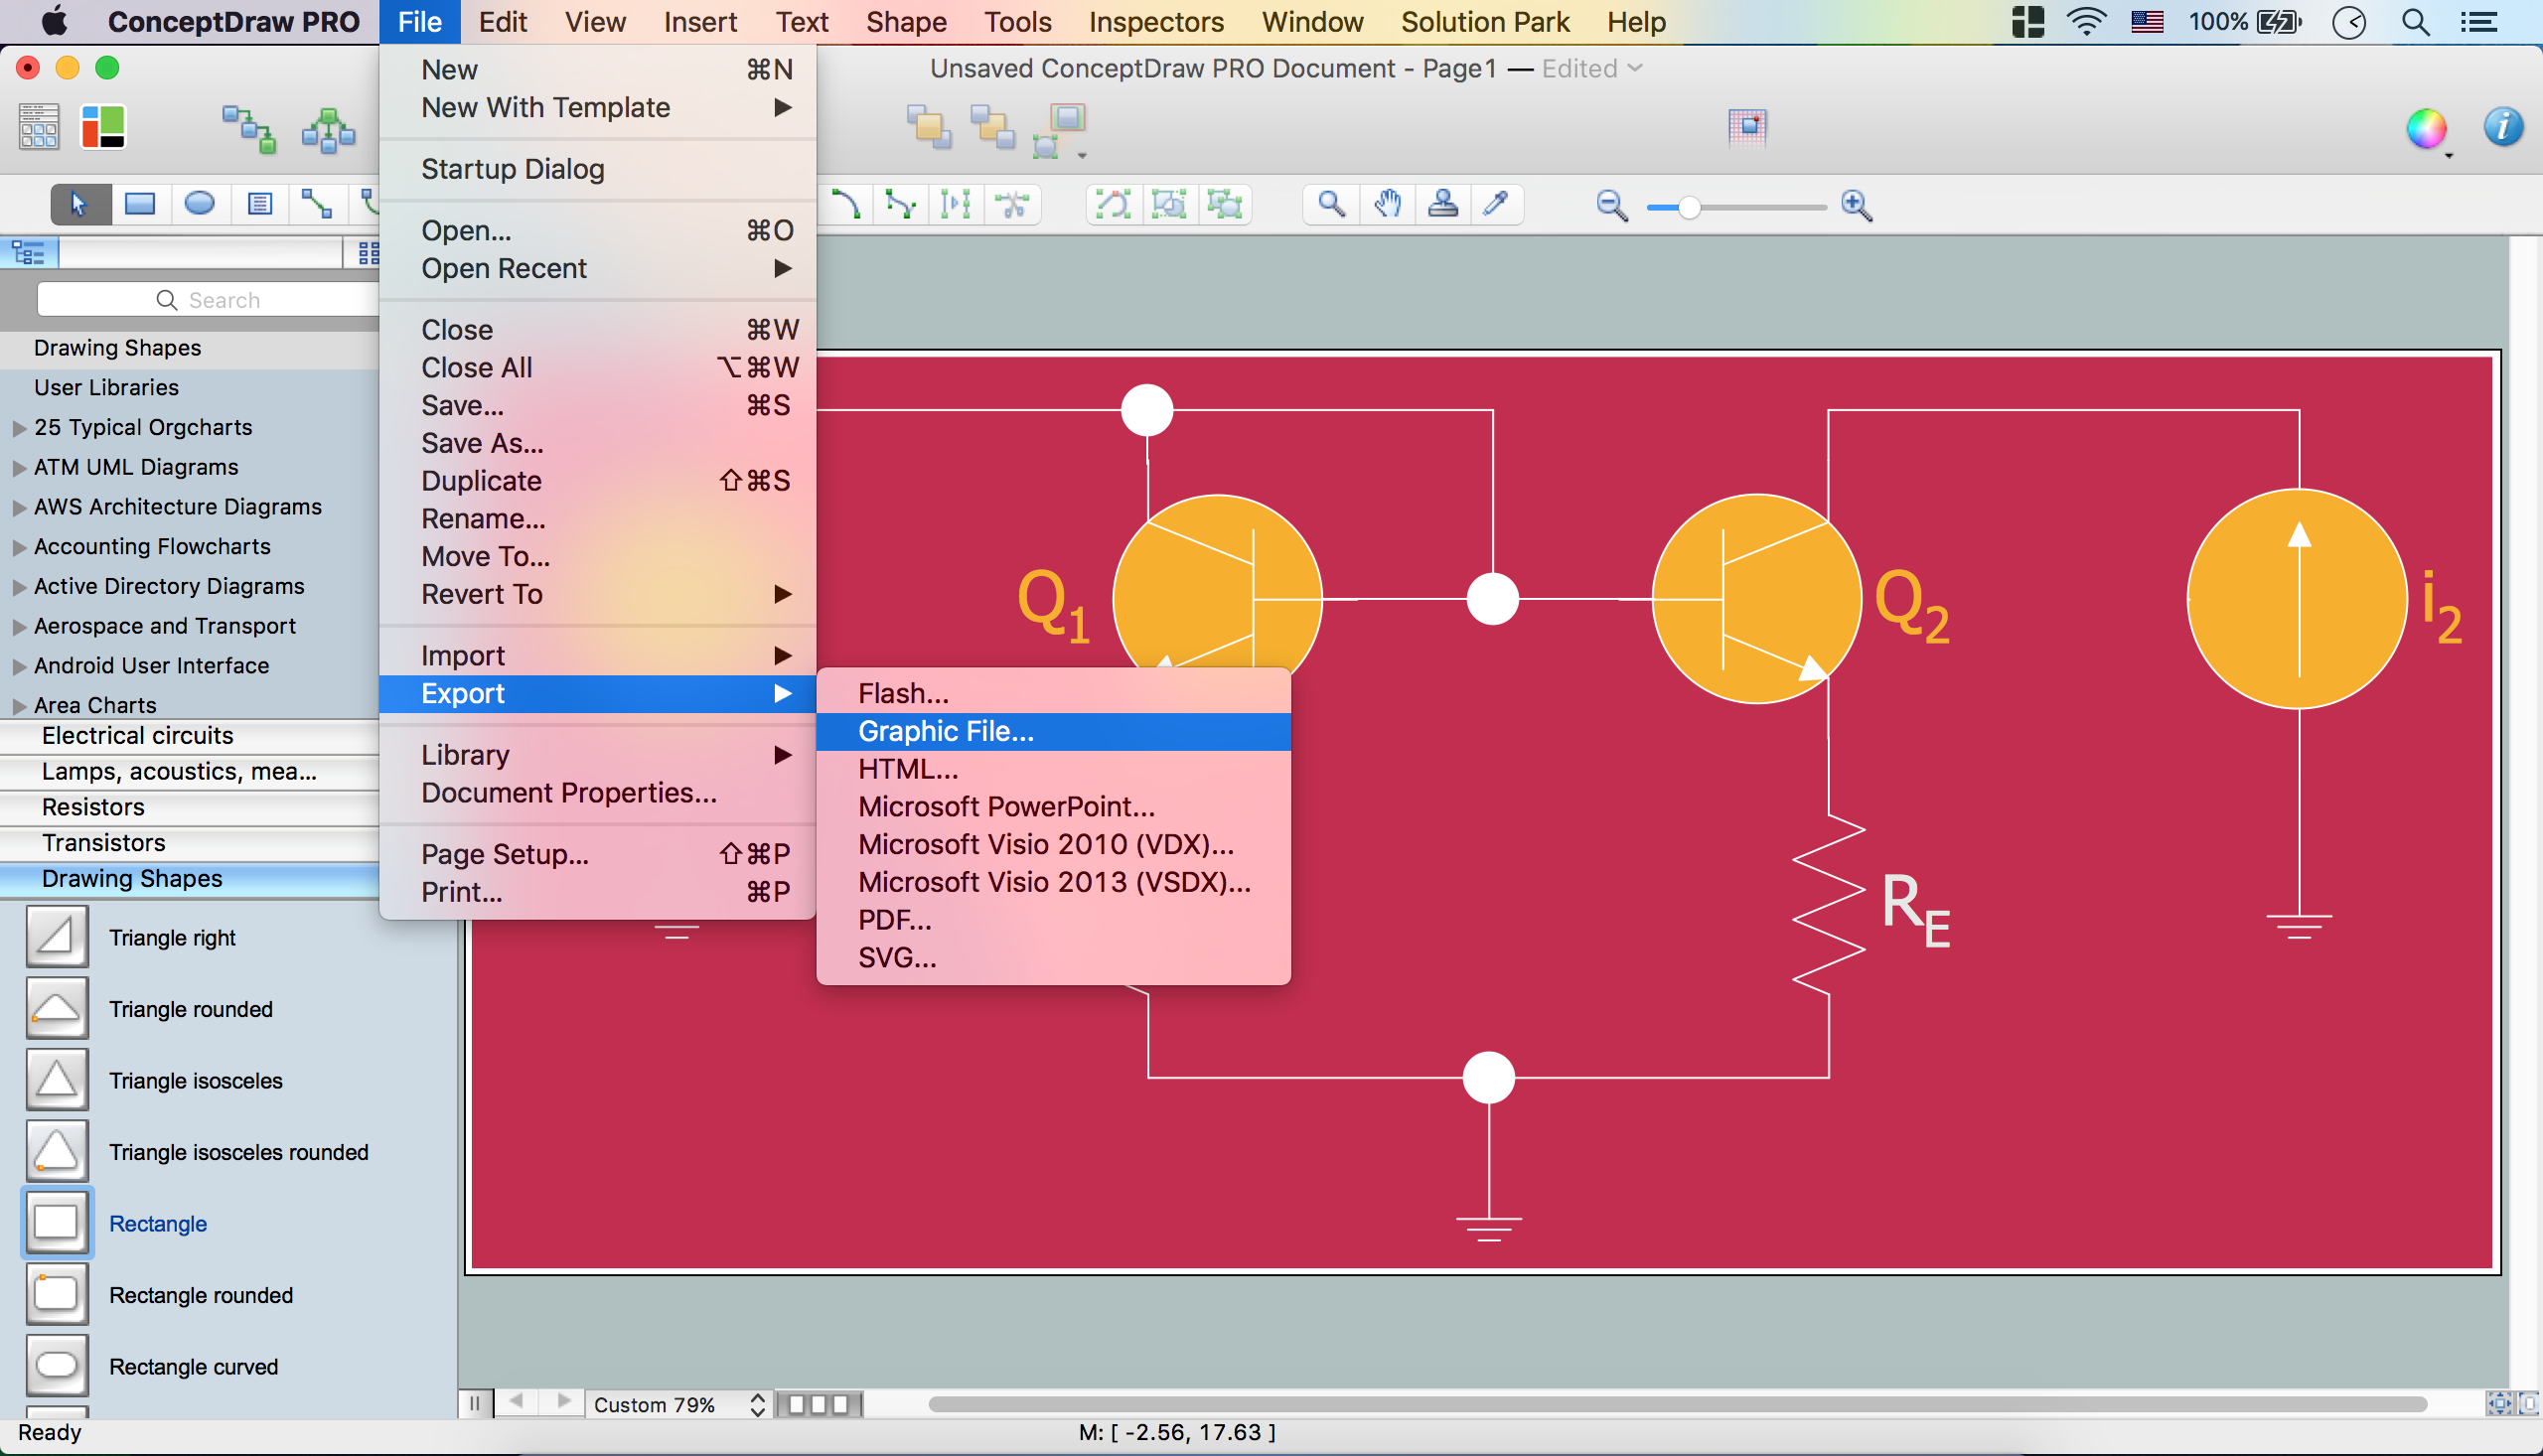
Electrical engineering and electronic engineering are extensive fields dedicated to research, design, development, manufacturing, test, and montage of systems and devices of electricity, electronics, microelectronics, telecommunications, power engineering, etc. These fields use various types of schemes, diagrams, technical drawings and require a special precision, accuracy and attention at their construction and using. The availability of modern specialized software has great importance for electrical engineers and electronic specialists, it assists them in drawing Electrical schematics and diagrams, Electrical drawings and Wiring schemes, Electronic Circuit schematics, etc. One of such software is ConceptDraw PRO extended with Electrical Engineering Solution that offers powerful drawing tools, wide variety of samples and libraries with numerous quantity of predesigned electrical symbols and vector objects of electrical devices. All they help design with minimal efforts Electrical diagrams and blueprints of any complexity, now drawing process is easy even for beginners.
Flowchart design. Flowchart symbols, shapes, stencils and icons
A flowchart is a type of diagram which represents an algorithm, process or workflow, displays the steps as boxes of various kinds and depicts their order by connecting them with arrows. Any business graphic document will be more colorful and understandable if will use professional-looking and visual diagrams and flowcharts. Flowchart design gives versatile presenting and explaining of the process. ConceptDraw PRO flowchart software enhanced with Flowcharts solution helps effectively make Flowchart Design. Use of predesigned flowchart symbols and bright color palette offers a fresh view and favorably distinguishes the flowcharts designed in ConceptDraw PRO from the black and white flowcharts on a paper. Preferably to use no more than three or four colors and apply identical for the same shape types. The best flowchart design can be achieved by starting with Flowchart template, or any of suitable ready examples or samples offered in ConceptDraw STORE, open one of them and enter the proper text into each Flowchart shape. Each symbol of the flowchart has a definition that can't be changed. This means that all flowcharts shapes can be grouped in according to their meaning. Users with ConceptDraw PRO flowchart software can style groups of symbols with close definitions by color sets chosen from complementary palette. Almost all workflows can be depicted as a flowchart. Colored diagrams are more light for perception of the certain information, this is part of flowchart design. Bright colors need to be used in the key points of Decision symbols, to focus attention on their importance for whole process flow.
Process Flowchart
The main reason of using Process Flowchart or PFD is to show relations between major parts of the system. Process Flowcharts are used in process engineering and chemical industry where there is a requirement of depicting relationships between major components only and not include minor parts. Process Flowcharts for single unit or multiple units differ in their structure and implementation. ConceptDraw PRO is Professional business process mapping software for making Process flowcharts, Process flow diagram, Workflow diagram, flowcharts and technical illustrations for business documents and also comprehensive visio for mac application. Easier define and document basic work and data flows, financial, production and quality management processes to increase efficiency of your business with ConcepDraw PRO. Business process mapping software with Flowchart Maker ConceptDraw PRO includes extensive drawing tools, rich examples and templates, process flowchart symbols and shape libraries, smart connectors that allow you create the flowcharts of complex processes, process flow diagrams, procedures and information exchange. Process Flowchart Solution is project management workflow tools which is part ConceptDraw Project marketing project management software. Drawing charts, diagrams, and network layouts has long been the monopoly of Microsoft Visio, making Mac users to struggle when needing such visio alternative like visio for mac, it requires only to view features, make a minor edit to, or print a diagram or chart. Thankfully to MS Visio alternative like ConceptDraw PRO software, this is cross-platform charting and business process management tool, now visio alternative for making sort of visio diagram is not a problem anymore however many people still name it business process visio tools.
Onion Diagram Maker
The onion diagram is a type of diagram which shows the dependencies among parts of an organization or process. The items are displayed at the concentric circles, where the items at the bigger rings depend on the items at the smaller rings. ConceptDraw PRO diagramming and vector drawing software extended with Stakeholder Onion Diagrams Solution from the Management Area of ConceptDraw Solution Park is a professional Onion Diagram Maker.The vector stencils library "Circular arrows diagrams" contains 20 templates of circular arrows diagrams and arrow donut charts.
Use these shapes to draw your circular arrows diagrams in the ConceptDraw PRO diagramming and vector drawing software.
The vector stencils library "Circular arrows diagrams" is included in the Circular Arrows Diagrams solution from the area "What is a Diagram" of ConceptDraw Solution Park.
Use these shapes to draw your circular arrows diagrams in the ConceptDraw PRO diagramming and vector drawing software.
The vector stencils library "Circular arrows diagrams" is included in the Circular Arrows Diagrams solution from the area "What is a Diagram" of ConceptDraw Solution Park.
Bubble diagrams with ConceptDraw PRO
Using ConceptDraw you will be able to create bubble diagrams from the ready ConceptDraw library objects or make your own objects. The created diagram can be saved and edited, objects can be moved and links between them will be automatically repainted after object moving because of using the ConceptDraw connectors.How to Build a Flowchart
The ConceptDraw PRO is a professional software for quick creating great looking flowcharts. The vector stencils from object libraries allows you to use RapidDraw technology. By the clicking on direction arrows one can add new object to flowcharts. This technology gives to users the ability to fast creating visualization for the structural data. Learn the basics of flowcharting and see how to build create a flowchart using ConceptDraw automatic drawing tools.IDEF0 standard with ConceptDraw PRO
The activity of any organization is more or less branchy network of processes. The description of these processes is a hard technical task which requires definite methodology and standards. According to the IDEF0 standard any process can be described in the form of a block (Activity Box) which has inputs and outputs. The process consists in transformation of inputs into outputs under the influence of the management and in the presence of necessary resources. Outputs of the given process later on can be either inputs for the next process or resources, or management means.
 Cloud Computing Diagrams
The Cloud Computing Diagrams solution extends the functionality of the ConceptDraw PRO diagramming software with a comprehensive collection of libraries of commonly accepted cloud computing vector stencils to help you to get started designing Cloud Computing Diagrams, Architecture Diagrams and Cloud Computing Architecture Diagrams without effort. This solution lets one professionally depict the way how the cloud computing works, allows giving a powerful introduction to the Cloud computing architecture and Amazon cloud computing architecture, to display the essence of the cloud computing, the main characteristics and classification of the cloud services thanks to the wide variety of predesigned samples and examples.
HelpDesk
How to Create a Cloud Computing Diagram Using ConceptDraw PRO
Cloud computing is a model of remote access to shared computing resources that are physically distributed in many remote devices. Cloud Computing is a technology that allows to use the Internet to place computing resources and the provision of such services to customers. Using cloud computing means assigning responsibilities on applications and data storage service among special systems, which have a very high level of reliability and unlimited resources. The result is reducing the cost of service, and to providing users with ready-to-use service. ConceptDraw's Cloud Computing Diagrams solution allows you to visualize cloud computing models of any configuration and complexity.Types of Flowchart - Overview
When designing a process or an instruction in clear and understandable way, you should consider creating a flowchart. You can avoid spending a lot of time understanding complex concepts as they get clear with different diagrams. The flowcharts are very popular diagram type, they are useful at different fields from the description business processes to the presentation of cooking recipes. Basic Flowchart, Business Process Modeling Diagram, Process Flowchart, Cross Functional Flowchart, Procedure Flowchart, Data Flow Diagram, IDEF Flowchart, SDL Diagram, Workflow Diagram, Document Flowchart, Program Flowchart, Value Stream Map, System Flowchart, Highlight Flowchart, Sales Flowchart are the main types flowchart. The ConceptDraw PRO is one of the professional applications which has great advantages and using which you can create different types of Flowcharts easy and fast. Try to draw an illustrative and comprehensible diagram in ConceptDraw PRO describing the processes instead of writing complex long text and make sure how it is convenient. Visio is expensive, and if you use it in a team environment, these costs are compounded. ConceptDraw PRO is an affordable alternative to Visio and luckily, it comes with a team plan. ConceptDraw PRO can import and export Visio files, so Mac users can collaborate with PC users stuck on Microsoft's software.
- Green Development Diagram
- Picture For Graph In Green Marketing
- Basic Flowchart Symbols and Meaning | Audit Flowchart Symbols ...
- Divided Bar Diagrams
- Divided Bar Diagrams
- Circular arrows diagrams - Vector stencils library | Circular arrows ...
- Circular arrows diagrams - Vector stencils library | Circular arrows ...
- Green Marketing Strategy
- Circular arrows diagrams - Vector stencils library | How to Create a ...
- Cisco Buildings. Cisco icons, shapes, stencils and symbols ...
- Circular arrows diagram - Template | Triangle scheme with arrows ...
- Circular Flow Diagram Template | Circular Arrow | Circular arrows ...
- Basic Flowchart Symbols and Meaning | Flowchart design ...
- Circular arrows diagrams - Vector stencils library
- Arrow circle chart - Template | How to Draw a Circular Arrows ...
- Business Process Reengineering Examples | BPR Diagram ...
- Target and Circular Diagrams | How to Draw a Circular Arrows ...
- How to Draw a Circular Arrows Diagram Using ConceptDraw PRO ...
- Basic Flowchart Symbols and Meaning | How to Add a Bubble ...
- Circular diagrams - Vector stencils library | Best Vector Drawing ...
